| |
|
|
Index to Degree-Day Data and Maps of USA
Click on a map for full region index page Home Introduction Suggestions for use
|
|
|
|
|
|
|
|
|
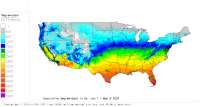
| Full USA |
| click map for full USA daily maps index |
 |
|
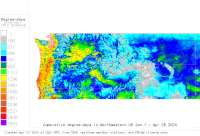
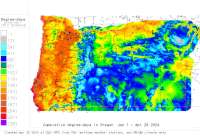
| Oregon |
 |
|
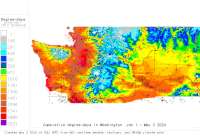
| Washington |
 |
|
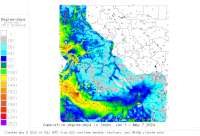
| Idaho |
 |
|
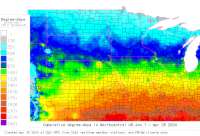
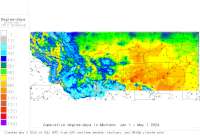
| Montana |
 |
|
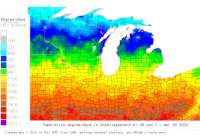
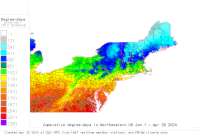
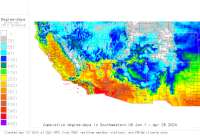
Introduction
These maps are calculated daily using the
GIS GRASS 5.4, and are based on 1) near-real time temperature data from
12,000+ AgriMet, HydroMet,
National Weather Service, RAWS, Snotel, and
weather stations from dozens of other networks, 2) historical average temperature data (1971-2000 Normals) from the National Climate Date Center (clim84),
3) PRISM monthly max
and min temperature maps, and 4) corrections based on inverse-distance squared interpolations
of differences between PRISM map-based and real-time degree-day calculations.Ā
See More info. on methodology for creating DD
maps. Also try out our
Degree-day Mapping Calculator for control over thresholds, calculation method, dates, and mapping options.
Suggestions for Use
With these maps, you can 1) track the extent of degree-day (heat unit) build-up so far this growing season using 3 common thresholds: 32°, 41°, and 50° F, 2) compare this year's heat unit build-up with 30-year historical average or "normal" heat units, 3) monitor deviations between the current year and normal heat-unit build up (which indicates how much warmer or cooler than normal the year has been so far), 4) select the full region or a single state and use the interactive interface, and 5) with GRASSLinks, interact with these maps by zooming and querying degree-days at specific locations, and use the site-specific degree-day calculator for the nearest weather station to where you click in the map.
|