Final Project Report to Western Regional IPM Program
- Extension (99-E-1)
INFORMATION EXCHANGE DRIVEN IPM:
APPLIED RESEARCH AND DECISION SUPPORT
March 15, 2001
Principal Investigators:
Leonard B. Coop, Research Associate, Dept. Entomology and Integrated Plant Protection Center
Marcos Kogan, Director, Integrated Plant Protection Center
Waheed Bajwa, Research Associate, Integrated Plant Protection Center
IPPC, Cordley 2040
Oregon State University, Corvallis, OR 97331
Summary
The overall goal of this project is to develop improved systems for
IPM information delivery and decision making. This project focuses on the
use of electronic media to exchange pest management weather, sampling, and
phenological data among growers, advisors, researchers and extension personnel.
A major portion of this includes building electronic resources, i. e. online
weather data networks and phenology models. The second year of this 2-year
project has expanded to include two grower-run weather networks in Oregon,
and publicly available networks throughout the entire Northwest (Oregon,
Washington, Idaho, Montana, Wyoming, and bordering stations in B. C. and
Alberta). We have also greatly expanded the range of models and weather
stations online. Currently, there are 43 specific phenology models linked
to over 500 weather stations. As mentioned in earlier reports, we will be
seeking a 1-year no-cost extension to allow time needed to strengthen and
further develop several aspects of the program. The system for online delivery
of pest models has been overhauled to improve ease of use and functionality,
as we continue to collaboratively improve upon and build new pest and beneficial
phenology models. Because the breadth and scope of this project has extended
beyond that envisioned, we have reduced emphasis on working directly with
data collection and monitoring networks within local pest management systems,
and instead are providing the resources (decision support tools) that will
support and enhance local IPM networks as they develop. We are
now working with several local pest management networks to provide the tools
needed for decision support, and expect for this trend to continue.
Objectives and Results to Date
Objective 1. Develop new and augment existing regional
pest monitoring networks in targeted cropping systems. Use commodity-delineated
IPM-interest email list communities to post and share real-time data and information.
Assure data quality and standards to serve applied research for improving
IPM phenology models and decision making.
This project has focused on support of pest monitoring networks by providing specific tools and products which bring new internet-based technologies to local IPM networks. Thus, we have stressed augmentation of existing networks, rather than developing new networks, largely because the wide breadth of this project (now encompassing a 5-state region) prohibits the focused time necessary to develop new monitoring networks. Local IPM networks that we are currently working with by developing new models and weather stations and other services include:
Hood River Tree Fruit District (Pear) - In collaboration with Prof.s H. Riedl and R. Spotts, and Extension Specialist S. Gastagnoli, Mid-Columbia Research and Extension Center (MCAREC), and the network of grower-operated on-farm weather stations (7 full data sites plus several rainfall only stations), we are hosting daily and 15-minute weather data to provide modeling needs for the entire growing region. The stations are maintained by personnel at MCAREC, where a base station is used to collect weather data from all stations at 15 minutes intervals, then export and transmit the data via FTP to our webserver in Corvallis, from which the data and linked models are available to anyone with internet/web access. The data, available through the Hood River webpage (Fig. 1), includes the current summary data, current and recent 15 minute tabular data, and daily data linked to the degree-day calculator program. We are developing new models such as for pear scab (detailed below) which utilize the 15 minute data. In addition, numerous models using daily weather data that are relevant for the tree fruit industry are linked to the weather stations via the phenology models program (detailed below).
A nearby cherry production region, The Dalles, is also in the process of assembling a grower-run weather station network, and we are in collaboration to eventually host their data and data products as well (probably by late 2001/early 2002).
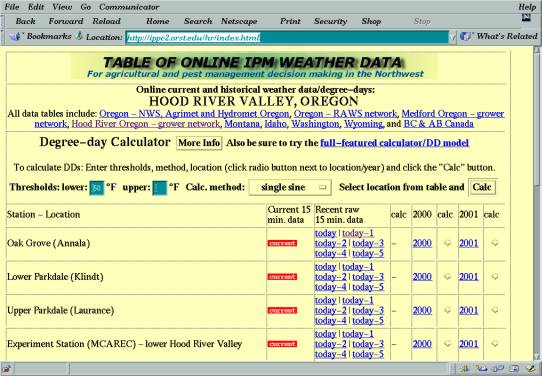
Fig. 1. A portion of the webpage of the Hood River grower-based weather station network showing web access to current and past daily and 15 minute weather data linked to the online degree-day calculator, as hosted at /hr.
Medford OR Tree Fruit District (Pear) - In a collaboration similar to that with the Hood River region, we are linking with the 10-station grower-based weather station network (organized and run by Bear Creek Orchards, Medford, OR) to our webserver in order to provide the added value of linking the data to models and degree-day maps. In response to a request from Bear Creek Orchard personnel, we have added a new daily degree-day map that will represent codling moth development in the region (Fig. 2).
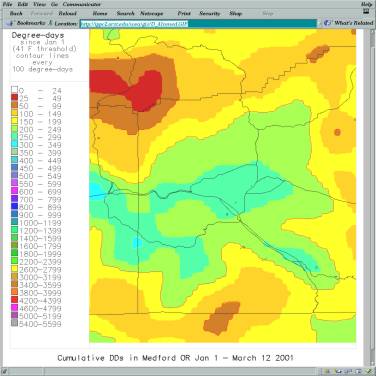
Fig. 2. Example Medford region degree-day map (41 F lower threshold) available from http://osu.orst.edu/ippc/wea/ddmaps.html . Following codling moth biofix, the 50 F lower threshold map will be used to map local development of codling moth degree-days. Also, these maps will soon be improved with more roads, agricultural areas outlined, and with downscaling to improve resolution (detailed below).
E. Oregon/SW Idaho (Treasure Valley) - In collaboration with Ben Simko, OSU Extension Service, Malheur Experiment Station, Ontario, we are working to support their IPM monitoring network with phenology modeling decision support tools. We have added a new model for the key pest of Alfalfa seed, Lygus hesperus (Simko, unpublished) (Fig 3). This IPM network has their own website at http://www.tvpestalert.net . They will be linking their website and an email list server to specific models and degree-day maps that are available from our server. In support of this IPM network we have also added a new map page to represent Lygus development in that region as well (example not shown, see http://osu.orst.edu/ippc/wea/ddmaps_n.html).
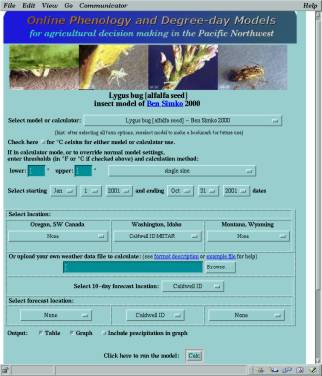
Fig. 3. New ddmodel.pl program shown for Lygus hesperus model of Simko (2000). The new interface features identification photos, selection and spanning of multiple years, bookmarking of location and model parameter settings, and an expanded number of locations for current, 10-day, and historical forecasting.
NE Oregon/Pendleton (wheat production regions) - In collaboration with Prof. Dan Ball, OSU Weed Scientist, Columbia Basin Agricultural Research Center, Pendleton, OR, we are supporting the modeling of downy brome, a pest of wheat that is best controlled during fallow periods just before seed set. In addition, we have added custom maps displaying downy brome degree-day accumulations (and deviations from normals) for Oregon and for the NE Oregon region (Fig. 7; http://osu.orst.edu/ippc/wea/ddmaps_n.html ).
Willamette Valley, W. Oregon - In collaboration with Prof.s Dan McGrath and M. T. AliNiazee OSU Entomology, we are improving and developing new models for vegetable and hazelnut monitoring networks, both funded separately through commodity commission grants. In hazelnut, data for filbertworm and European leafroller model improvement and validation is an integral part of the monitoring program.
Idaho - vegetable production - In collaboration with Prof. Ed Bechinski, UI Entomology, we have added many new Idaho weather stations to support their IPM monitoring networks, and a new model for sugarbeet root maggot (detailed below).
Montana - MSU IPM cutworm network - In collaboration with Will Lanier and Sue Blodgett, MSU Entomology, we are hosting weather station data and models in support of the cutworm monitoring network (separately funded through a WR IPM project). The cutworm monitoring and reporting network is hosted at an MSU website, at http://cutworm.org . Our project supports this monitoring network through hosting 94 Montana and 36 Wyoming weather stations linked to degree-day calculators and models. Future developments are expected to include addition of specific phenology models for western pale cutworm and army cutworms, calibration of the bertha armyworm model for Montana/high plains states, and automated creation of cutworm degree-day maps for Montana and Wyoming.
Montana - Crop models - In collaboration with Prof. P. Miller, MSU Crop Scientist, phenology models for 14 Montana-grown crops have been incorporated into the phenology models database (detailed below). Many of these models were developed in nearby states and most have potential for validation throughout the Northwest.
Objective 2. Support and augment IPM monitoring and information exchange by accelerated development and expansion of an IPM information exchange decision support system (NW-IPMnet), that integrates static and dynamic information through use of telecommunications with emphasis on email and the world-wide-web.
We have been improving the decision support resources continually for support of this program, especially in the areas of online weather networks, the phenology modeling delivery system (on the web at http://osu.orst.edu/dept/ippc/wea, homepage shown in Fig 4.), and development of specific phenology models.
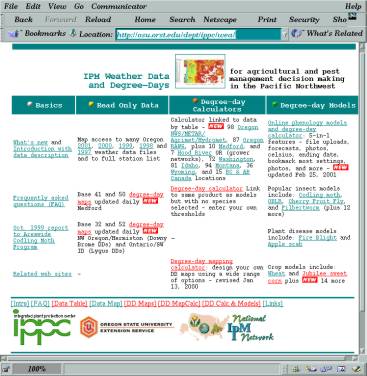
Fig. 4. Newly revised homepage for IPM Weather Data and Degree-Days, NW-IPMnet, at http://osu.orst.edu/dept/ippc/wea , displaying several additional website features not detailed in this report.
Highlights of these improvements include:This project has focused on support of pest monitoring networks by providing specific tools and products which bring new internet-based technologies to local IPM networks. Thus, we have stressed augmentation of existing networks, rather than developing new networks, largely because the wide breadth of this project (now encompassing a 5-state region) prohibits the focused time necessary to develop new monitoring networks. Local IPM networks that we are currently working with by developing new models and weather stations and other services include:
Hood River Tree Fruit District (Pear) - In collaboration with Prof.s H. Riedl and R. Spotts, and Extension Specialist S. Gastagnoli, Mid-Columbia Research and Extension Center (MCAREC), and the network of grower-operated on-farm weather stations (7 full data sites plus several rainfall only stations), we are hosting daily and 15-minute weather data to provide modeling needs for the entire growing region. The stations are maintained by personnel at MCAREC, where a base station is used to collect weather data from all stations at 15 minutes intervals, then export and transmit the data via FTP to our webserver in Corvallis, from which the data and linked models are available to anyone with internet/web access. The data, available through the Hood River webpage (Fig. 1), includes the current summary data, current and recent 15 minute tabular data, and daily data linked to the degree-day calculator program. We are developing new models such as for pear scab (detailed below) which utilize the 15 minute data. In addition, numerous models using daily weather data that are relevant for the tree fruit industry are linked to the weather stations via the phenology models program (detailed below).
A nearby cherry production region, The Dalles, is also in the process of assembling a grower-run weather station network, and we are in collaboration to eventually host their data and data products as well (probably by late 2001/early 2002).

Fig. 1. A portion of the webpage of the Hood River grower-based weather station network showing web access to current and past daily and 15 minute weather data linked to the online degree-day calculator, as hosted at /hr.
Medford OR Tree Fruit District (Pear) - In a collaboration similar to that with the Hood River region, we are linking with the 10-station grower-based weather station network (organized and run by Bear Creek Orchards, Medford, OR) to our webserver in order to provide the added value of linking the data to models and degree-day maps. In response to a request from Bear Creek Orchard personnel, we have added a new daily degree-day map that will represent codling moth development in the region (Fig. 2).

Fig. 2. Example Medford region degree-day map (41 F lower threshold) available from http://osu.orst.edu/ippc/wea/ddmaps.html . Following codling moth biofix, the 50 F lower threshold map will be used to map local development of codling moth degree-days. Also, these maps will soon be improved with more roads, agricultural areas outlined, and with downscaling to improve resolution (detailed below).
E. Oregon/SW Idaho (Treasure Valley) - In collaboration with Ben Simko, OSU Extension Service, Malheur Experiment Station, Ontario, we are working to support their IPM monitoring network with phenology modeling decision support tools. We have added a new model for the key pest of Alfalfa seed, Lygus hesperus (Simko, unpublished) (Fig 3). This IPM network has their own website at http://www.tvpestalert.net . They will be linking their website and an email list server to specific models and degree-day maps that are available from our server. In support of this IPM network we have also added a new map page to represent Lygus development in that region as well (example not shown, see http://osu.orst.edu/ippc/wea/ddmaps_n.html).

Fig. 3. New ddmodel.pl program shown for Lygus hesperus model of Simko (2000). The new interface features identification photos, selection and spanning of multiple years, bookmarking of location and model parameter settings, and an expanded number of locations for current, 10-day, and historical forecasting.
NE Oregon/Pendleton (wheat production regions) - In collaboration with Prof. Dan Ball, OSU Weed Scientist, Columbia Basin Agricultural Research Center, Pendleton, OR, we are supporting the modeling of downy brome, a pest of wheat that is best controlled during fallow periods just before seed set. In addition, we have added custom maps displaying downy brome degree-day accumulations (and deviations from normals) for Oregon and for the NE Oregon region (Fig. 7; http://osu.orst.edu/ippc/wea/ddmaps_n.html ).
Willamette Valley, W. Oregon - In collaboration with Prof.s Dan McGrath and M. T. AliNiazee OSU Entomology, we are improving and developing new models for vegetable and hazelnut monitoring networks, both funded separately through commodity commission grants. In hazelnut, data for filbertworm and European leafroller model improvement and validation is an integral part of the monitoring program.
Idaho - vegetable production - In collaboration with Prof. Ed Bechinski, UI Entomology, we have added many new Idaho weather stations to support their IPM monitoring networks, and a new model for sugarbeet root maggot (detailed below).
Montana - MSU IPM cutworm network - In collaboration with Will Lanier and Sue Blodgett, MSU Entomology, we are hosting weather station data and models in support of the cutworm monitoring network (separately funded through a WR IPM project). The cutworm monitoring and reporting network is hosted at an MSU website, at http://cutworm.org . Our project supports this monitoring network through hosting 94 Montana and 36 Wyoming weather stations linked to degree-day calculators and models. Future developments are expected to include addition of specific phenology models for western pale cutworm and army cutworms, calibration of the bertha armyworm model for Montana/high plains states, and automated creation of cutworm degree-day maps for Montana and Wyoming.
Montana - Crop models - In collaboration with Prof. P. Miller, MSU Crop Scientist, phenology models for 14 Montana-grown crops have been incorporated into the phenology models database (detailed below). Many of these models were developed in nearby states and most have potential for validation throughout the Northwest.
Objective 2. Support and augment IPM monitoring and information exchange by accelerated development and expansion of an IPM information exchange decision support system (NW-IPMnet), that integrates static and dynamic information through use of telecommunications with emphasis on email and the world-wide-web.
We have been improving the decision support resources continually for support of this program, especially in the areas of online weather networks, the phenology modeling delivery system (on the web at http://osu.orst.edu/dept/ippc/wea, homepage shown in Fig 4.), and development of specific phenology models.

Fig. 4. Newly revised homepage for IPM Weather Data and Degree-Days, NW-IPMnet, at http://osu.orst.edu/dept/ippc/wea , displaying several additional website features not detailed in this report.
- I. Expanded online weather station networks. Additions of near-real time weather
station reports (from Agrimet and Hydromet [Bur. Reclamation], National Weather
Service [METAR and COOP], US Forest Service and Bureau of Land Management
[RAWS], and grower-run networks) have been incorporated into the IPPC online
weather data and phenology modeling website for a total of 500 sites in Oregon,
California, Washington, Montana, Wyoming and the southern edge of British
Columbia and Alberta, Canada. This assemblage now includes 126 NWS/METAR,
92 NWS/COOP, 42 Agrimet, 19 Hydromet, 204 RAWS, and 17 grower-operated stations.
The station breakdown by state is 202 in Oregon, 72 in Washington, 81 in
Idaho, 92 in Montana, 36 in Wyoming, 13 in B. C., and 2 in Alberta, Canada.
The grower-supported networks (detailed elsewhere in this report) are located
in Hood River and Medford Tree Fruit growing regions. The network of 10-day
forecast sites using weather.com data (
http://www.weather.com) now includes 10 sites in Oregon, 6 in Washington,
10 in Idaho, 9 in Montana, and 5 in Wyoming (40 total). This expansion of
stations and networks of near real time data (up from 102 stations, Oct 1999,
and 252 stations Feb. 2000) represents the recognition that the infrastructure
under construction for 1 state need not require duplication of effort in
nearby states, when needs and services are similar. We originally intended
to support Oregon, Idaho, and Washington as representing the Pacific Northwest
region, but following requests from Montana (MSU), have expanded to include
Wyoming and S. Canada. This will help leverage the investments made to develop
phenology models and maps for Oregon and the Pacific Northwest, and further
leverage developments such as to automate the estimation and interpolation
of missing weather data. A new basic tabular webpage format has been developed
to deliver access to data and degree-days on a state by state basis (plus
grower-run networks as displayed in Fig. 1). A script has been developed
that automates generation and updating of these tabular interfaces for all
states and regions included in this network. For example, all years, historical
data, latitude, longitude, elevation, and links to current real-time data
(if available) (see Fig. 1, Hood River grower network, and Fig. 5, Idaho,
for example) are all automatically built into table-based webpages using
the script. In addition, all locations used for pulldown menus in the ddmodel.pl
application (Fig. 3) are also automatically generated with the script. It
is a goal of this project to automate all routine operations such as webpage
updates and estimation of missing weather data. Achievement of this goal will
mean that very little current and future funding allocation for program maintenance
will be required, assuring the self-sustainability of the project, and allowing
greater use of resources for developing new models and for other uses of
the weather data.
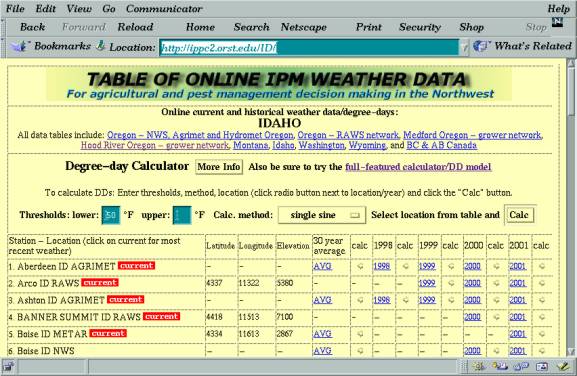
Fig. 5. Example data access and degree-day calculator page (small portion of Idaho page with 6 of 81 sites displayed) showing calculator inputs, weather station locations and, if available, links to current real-time data (hosted by NWS, Missoula MT), station coordinates and elevation, historical average data, prior years daily data, and current year daily data.
- II. New features added to existing online phenology modeling tools.
A new version of the online applications for both degree-day calculations
and phenology modeling (Fig. 3) was developed and deployed July 1999, and
has been under continuous improvement up to the present (March 2001). The
latest version (V. 3.01), at
/cgi-bin/ddmodel.pl, combines all existing feature
of earlier tools, and adds new features, including:
a) Degree-day calculator - all online 500 weather sites from the 5 state NW US plus SW Canada are linked to the general purpose online degree-day calculator allowing computation of degree-days by several calculation methods, including simple, growing, single triangle, double triangle, single sine, double sine, heating and cooling degree-days. This calculator has 10-day and historical average forecasting and parameter bookmarking capabilities for the first time.
b) Phenology models - a database currently holding 43 phenology models from apple scab to winter wheat (listed below) is linked to the application via a simple pull-down menu, as well as through bookmarking individual models, to facilitate web hyper-links from various online pest management resources. Collaborators now have an easy to use web interface to the phenology models database, with password protection, to allow others' participation in model development and calibration. Also, for end users using the new tool, when a particular species model is selected, the fill-out form displays available links to model documentation and to other websites with decision-support information.
New features added as of Mar. 2001 include the ability to bookmark nearly all parameter settings, such as the BIOFIX date, the end date, thresholds, calculation method, a Celsius option, and the current weather, 10-day forecasted weather, and historical average weather forecast locations. This extended bookmarking feature will greatly expand the ease of use of the tool and begin the process for development of a portal approach to the presentation of phenology model results on the web (as part of more complex and dynamic websites). It can be pointed out that, while bookmarking of modeling parameters may seem trivial by the use of the CGI GET protocol, this program must use the POST protocol to allow file uploads (see below), making the bookmarking feature a novel and non-trivial, yet time saving feature for end-users.
In addition, a photo identification feature has been added (ex. Fig. 3) which improves both the attractiveness and utility of the program. The small photos (typically of most life stages and plant injury) are linked to larger images detailed enough to aid in positive identification of the species or product. At this time, photos have been added for nearly all insects, plant diseases and weeds, but not for the crop models.
c) File uploads - this feature allows anyone with locally collected data to upload the data for use within the application. This means that the calculator and models can be used from anyplace connected to the internet, and helps to regionalize and extend the value of the website within the entire Northwestern region.
d) Forecasts - We have included options for 10-day forecasts provided daily by weather.com (40 sites as of March 2001, up from 12 in Oct. 1999) and historical average data for longer term forecasts (currently with ca. 200 sites). Short range forecasts are particularly helpful in the forecasting of fireblight and apple scab risk, whereas the historical forecasts are very useful for longer-term forecasting needs of insect and crop development models.
e) Graphics - a new server-side application was developed that automatically graphs the data to provide additional interpretation of calculator and model results (Fig. 6). This optional feature can also display daily precipitation in addition to cumulative degree-days and dates and labels of phenological events, and displays current versus historical average degree-days.
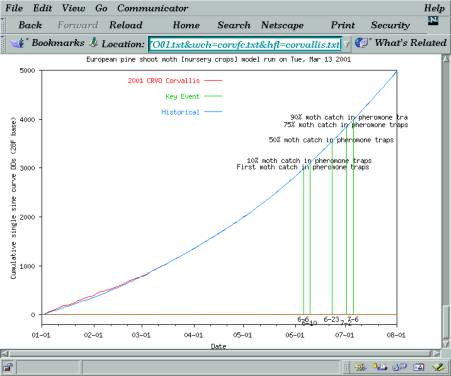
Fig. 6. Example degree-day plot (European Shoot Moth, Rhyacionia buoliana ), to summarize and aid interpretation of phenological model results. Current degree-days in red, followed by 10-day and historical forecasted degree-days shown with blue lines, showing that degree-day accumulations thus far in 2001 are equal to the historical average.
f) Celsius - for the first time with this version, all results may be viewed in Celsius in addition to Fahrenheit, making the tool more useful to researchers and others using the metric system.
g) User selectable start and end dates - previous tools assumed either that degree-day calculations begin January 1 or that degree-day calculations end on the current date, limiting the utility of the tools. The new version allows both to be selected by the user. As of March, 2001, this feature has been extended to allow the entry of year, which both allows use of multiyear models, and for use of the program for previous years' weather data. The ability to span new years is especially helpful for use of the program in the Southern Hemisphere, as we are beginning the process of internationalizing this system, that will allow deployment by agencies in other regions and other parts of the world.
While these new features represent evolutionary improvements, they are now combined into a single comprehensive web-hosted application that will require less maintenance than earlier applications that each had particular features, limitations, and input requirements. This will also allow future developments to be focused on a single version. The new version, written in the Perl language, is also now run from a more stable and versatile server than were the earlier programs.
- II. New features added to existing online phenology modeling tools.
A new version of the online applications for both degree-day calculations
and phenology modeling (Fig. 3) was developed and deployed July 1999, and
has been under continuous improvement up to the present (March 2001). The
latest version (V. 3.01), at
/cgi-bin/ddmodel.pl, combines all existing feature
of earlier tools, and adds new features, including:


- III. Web-based phenology and risk potential models. Our online database of phenology models has a total of 43 models at this time (March 2001; up from 16, as of Oct. 1998 and 21, as of Feb. 2000). We are developing further collaborations with researchers around the 5-state Northwest region to improve existing and add new models in the near future. A web-based database system for phenology models was developed for easy input and management of model parameters. This database was recently expanded to include fields for information on region of model development/deployment, brief instructions for determining biofix date, and up to 16 phenological events. At this time, the following species models are in the database and accessible online:
- Bertha armyworm [vegetables and peppermint] (Bailey 1976)
- Black cutworm [vegetables] (Luckmann et al. 1976)
- Cabbage looper [vegetables] (Toba et al. 1973)
- Corn earworm [sweet corn] (Hartstack et al. 1976)
- Western cherry fruit fly [cherry] (AliNiazee 1979)
- Codling moth [apple & pear] (Brunner and Hoyt 1987)
- European pine shoot moth [nursery crops] (Regan et al. 1990)
- Filbertworm [hazelnut] (Aliniazee 1983)
- Isomate c+ [codling moth mating disruption] (Pacific Biocontrol Corporation 1999)
- Lygus bug [alfalfa seed] (Simko 2001)
- Metaseiulus occidentalis (Tanagoshi et al. 1975 )
- Mint flea beetle (Berry et al. 1988)
- Mint root borer (Berry et al. 1981)
- Neoseiulus fallacis mite predator model (Dover et al. 1979)
- Obliquebanded leafroller [tree fruits] (Brunner et al. 1997)
- Obliquebanded leafroller [hazelnut] (Gangavalli and Aliniazee 1985)
- Orange tortrix (cold winter) [small fruit] (Knight 1988)
- Orange tortrix (mild winter) [small fruit] (Knight 1988)
- Pandemis leafroller [tree fruits] (Brunner 1991)
- Sugarbeet Root Maggot (Bechinski et al. 1990)
- San Jose Scale [tree fruits] (Rice et al. 1982)
- Strawberry root weevil [peppermint] (Cacka 1982)
- Variegated cutworm [peppermint] (Coop and Berry 1987)
- Apple scab infection period (Gadoury 1994)
- Fireblight infection risk (Smith 1999)
- Pear scab infection period (R. Spotts OSU)
- Downy brome (D. Ball OSU)
- Winter wheat Karow et al. (1993)
- Sweet corn (Coop 1991)
- Barley (P. Miller MSU)
- Wheat (P. Miller MSU)
- Oat (P. Miller MSU)
- Flax (P. Miller MSU)
- Canary (P. Miller MSU)
- Canola (P. Miller MSU)
- Canola (Polish) (P. Miller MSU)
- Mustard (Brown and Oriental) (P. Miller MSU)
- Mustard (Yellow) (P. Miller MSU)
- Chick pea (Desi) (P. Miller MSU)
- Lentil (P. Miller MSU)
- Pea (yellow) (P. Miller MSU)
- Safflower (Saffire) (P. Miller MSU)
- Sunflower (P. Miller MSU)
- Lygus bug
- Sugarbeet Root Maggot
- MSU crop models
- Downy Brome
- Peppermint pest models
- Predator mite models
- Filbertworm (key pest of Hazelnut)
- Fireblight [Pear]
- Pear Scab [Pear]
- Isomate C+ [codling moth mating disruption dispensers]
A) Insect/mite models
B) Plant Disease Models
C) Weed Models
D) Crop Models
A brief summary of several online models that are undergoing recent or current development as a result of this project include:
A new model for Lygus bug, developed by Ben Simko, OSU Extension Entomologist,
Malheur Experimental Station, provides the Alfalfa seed industry of E. Oregon/SW
Idaho with a tool for alerting growers to the time to expect peak incidence
of small nymphal Lygus bugs, for intensifying monitoring and control efforts.
In cooperation with Prof. Ed Bechinski, U. Idaho Entomologist, We have
implemented a model for sugarbeet root maggot (Bechinski et al. 1990). This
model is the first insect model that represents events as other than simple
accumulation of degree-days after a biofix date. In this model, peak capture
of flies is predicted once air temperature reaches a maximum greater than
26.7 C (80 F) following the accumulation of 200 DDs (CC) after 1 March. While
this separate max. temperature event is simple, the model will now be more
readily able to accommodate other exceptions and non-DD "triggers".
Prof. Perry Miller, MSU Crop Scientist, has collected 14 crop models
ranging from cereals to legumes to specialty crops from a variety of sources
(Lancaster et al 1991, MSU 1985, Schneitzer and Miller 1981, SPGB 2000, Tanaka
et al. 2000, unpublished data). These models are generally used to predict
around 10 growth stages from first leaf to harvest, and will help producers
become more familiar with using phenology models for crop production in addition
to pest management needs.
In cooperation with Prof. Dan Ball, OSU Weed Scientist, Pendleton, we
have implemented a new model for prediction of timing for control of downy
brome, a widespread pest of grains. The model estimates optimum timing for
control prior to seed set. Cooperators in most western and Northern Plains
states have collected validation data for the model, which will soon undergo
fine tuning and improved documentation. For the growers in the Pendleton/Hermiston/La
Grande region, we have added a daily degree-day map for downy brome at a
new web page, http://www.orst.edu/Dept/IPPC/wea/ddmaps_n.html
. The daily downy brome maps (Fig. 7) will help display regional differences
in downy brome development and alert producers about timely and more optimal
weed monitoring and control.
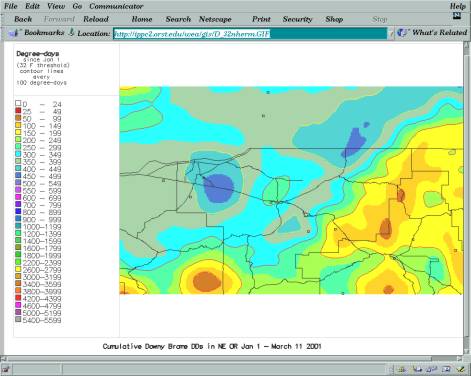
Fig. 7. Example daily degree-day map used to display phenology of downy brome, a weed pest of wheat throughout NW USA (shown for NE Oregon).

Fig. 7. Example daily degree-day map used to display phenology of downy brome, a weed pest of wheat throughout NW USA (shown for NE Oregon).
In cooperation with Prof. Ralph Berry, OSU Entomology Dept. we are developing
and improving models for several pests of peppermint, an important specialty
crop in Oregon and Washington. These pests include variegated cutworm, mint
flea beetle, mint root borer, bertha armyworm, and strawberry root weevil,
as well as the predator mite N. fallacis. These models are being tested and
validated as a part of IPMP (integrated pest management in peppermint) version
3.0, an online decision support system that integrates insect, weed, disease,
and nematode management.
We have implemented predator mite models for two important Phytoseiidae
species that are used extensively for the biological control of spider mites
in a wide range of crops. These include Neoseiulus fallacis and
Metaseiulus occidentalis. These are simple generation-time models that
nevertheless can be very useful in training and understanding the use of
these predators in augmentative biological control efforts, in crops such
as peppermint, strawberry, and nursery plants.
A revised model for filbertworm is now undergoing validation studies,
in collaboration with M. T. AliNiazee and Lief Gunderson, Oregon State University,
and with Jim Todd, IPM private consultant. The original filbertworm model
was relevant only to pheromone trap cumulative catch, whereas separate data
from recent field monitoring and from a graduate M.S. Theses (Kelly 1987)
have yet to be fully integrated and validated. We are supervising this effort
and expect an expanded model to be validated for the 2002 growing season.
In collaboration with Prof. Ken Johnson, OSU Plant Pathologist, Corvallis,
we are developing several improvements to the fireblight model (also known
as cougarblight), which was originally adapted for the Pacific Northwest
by Dr. Tim Smith, WSU Extension. The current table lookup method of computing
degree-hours will be replaced with a more accurate formula for direct computation
of fireblight degree-hours. Prof. Johnson is also performing validation studies
relating actual risk to weather.com 10-day forecasted risk estimates.
In collaboration with Dr. Bob Spotts, OSU Plant Pathologist, Hood River,
two new pear scab models are under development. A simple model for the pear
scab infection season is now online. A more complex model (based mainly on
the work of Spotts and Cervantes 1991) to predict risk of a pear scab ascospore
infection event, to be based on 15 minute or hourly temperature and leaf
wetness, is under development and is expected to be online by the 2002 season.
We are now posting Hood River weather network real-time 15 minute weather
data (Fig. 1) and will be able to compute pear scab infection risk as another
column in these reports.
In cooperation with Glenn Thayer of the Pacific Biocontrol Corp., we
have developed a degree-day model for predicting the lifetime of mating disruption
pheromones. This model represents a novel approach to predicting the efficacy
for the primary mating disruption dispenser used in Washington and Oregon
(currently isomate C+ is used in ca. 95,000 acres of Pome fruits in WA, or
ca. 50% of all acreage). We are currently collaborating in the analysis
of wind run data to improve the utility of the model for all regions. A more
complete description of the first version of this model was reported on previously
(Feb. 2000 progress report). We are developing a publication that describes
temperature and wind effects on dispenser release rate and on development
of the model.
Several additional models are under development that are intended for deployment in the near future, including:
European leafroller (pest of Hazelnuts and some tree fruits) - in collaboration with M. T. AliNiazee and Lief Gunderson, OSU Entomology Dept.
Black vine weevil (pest of nursery plants and small fruits) - in collaboration with commercial nurseries and Dr. James Fisher, USDA Entomologist, Corvallis OR.
Obliquebanded leafroller (cherry) - in collaboration with M. Omeg and H. Riedl, MCAREC Hood River OR, a new OBLR model specific to sweet cherry in The Dalles, Oregon, is near completion. OBLR is a good example of an organism that responds to temperature differently on different food hosts (Omeg 2001), thus requiring a separate model for each host.
Pod gall midge (pest of nursery plants) - in collaboration with Robin Rosetta, OSU Extension Entomologist, Aurora Oregon.
Tetranychus urticae (2-spotted spider mite, ubiquitous pest) - generation time model, in collaboration with B. A. Croft, OSU.
European cranefly (pest of lawns and grass seed) - in collaboration with Prof.s Glenn Fisher and Sujaya Rao, OSU Entomologists.
- IV. New features added to existing online daily degree-day maps. In addition to the ongoing presentation of daily degree-day maps available for Oregon, N. Central Oregon, Hood River Oregon, and The Dalles, Oregon, at http://www.orst.edu/Dept/IPPC/wea/ddmaps.html, and in response to requests for specific degree-day maps from collaborators, we have added daily maps for 3 new regions. These include the Medford growing region, for display of codling moth degree-days for the tree fruit industry, the Pendleton/Hermiston/La Grande OR region, for display of downy brome degree-days, and the Ontario OR/SW ID region, for display of Lygus hesperus degree-days (all detailed above). Additional line data (roads, waterways, agricultural lands) and downscaled resolution (described below) will be added to enhance these maps in the near future. A system to extend standard daily degree-day maps for other Northwestern states (WA, ID, MT, and WY) is in development.
- V. New features added to existing online phenology mapping tool. The phenology mapping program, /cgi-bin/mapmaker.pl has been improved with a feature to compare current versus last year's degree-day maps, in the form of difference maps, in a fashion similar to the existing ability to compare current versus historical average degree-days. These map views of current vs. previous and current vs. historical average degree-days provide a helpful summary that highlight differences across regions due to local weather patterns. Also, new region views were added to make the program more versatile for all parts of Oregon.
A major improvement to daily and interactive phenology maps under development is a downscaling algorithm, that will greatly improve map resolution, using higher resolution DEM (digital elevation model) data. These maps are downscaled from 4 km to 500 m or better using local regressions between elevation and degree-days. A website describing the algorithm and preliminary validation is online at /dscale . A more extended validation and invitation for review by Oregon Climate Service/PRISM project personnel and the GIS community are underway. A prototype map, available for the Mid-Columbia OR region from an online session with the the mapmaker.pl program is presented in Fig. 8. The new downscaled maps will greatly expand the utility of degree-day maps for local use by individual growers. The ability to show spatial differences in degree-day accumulations at a scale of 500m or better can begin to highlight management needs within a single field or orchard, and can allow combining of these maps with other maplayers such as soil type, water requirements, pest survey maps, and fertilizer inputs to allow a precision farming/GIS approach to improving crop production.

Fig. 8. Example new prototype higher-resolution, "downscaled" degree-day map produced from online tool at /cgi-bin/mapmaker.pl , showing ca. 200 degree-days accumulation difference between Hood River Experiment Station and Parkdale, Oregon. Orchard regions outlined in blue. Roads indicated in gray.
Objective 3. Track and document adoption rates and relative success of new technologies for improvement of IPM systems.
No end-user surveys or other data have yet been collected to allow comprehensive reporting on this objective at this time, other than to cite the rate of use of some website features. The overall number of web-site accesses or hits would include all web pages, programs, and graphics, and would approach perhaps 100,000. This number is less meaningful than a more selective approach like looking at the dynamic applications such as the degree-day calculating and modeling application (ddmodel.pl, new since July 1999), which has received ca. 17,650 accesses between Jan. 30, 1999 and Mar. 11, 2001. This can be divided into ca. 51% of accesses via the state/regional tables (ex. Fig. 5), which thus far do not use an accessory plotting program (ex. Fig. 6) or forecast data, and ca. 49% by direct access through the ddmodel.pl interface (Fig. 3), which does use the plotting feature. This is interesting in showing how the simpler table interface that has very few features, remains about as popular as the full-featured, yet more complicated interface. The degree-day mapping program has received ca. 2,751 accesses over the same period. We are planning to conduct a survey of users, and while there is evidence that users span the full range including Extension agents, grower cooperatives & packing house field departments, agricultural and pest management consultants, meteorological consultants, researchers and graduate students, we will focus chiefly on 2 types of surveys by the end of the 2001 growing season: a survey of Extension personnel, and an online survey of all users. In addition, feedback from many of these users via email has been received, usually for support, to report bugs or to request new features. Since the website is available to the whole world, requests for information on models and degree-days have come in from places including Canada, Spain, and Australia, whereas website use comes from practically every country connected to the web.
Ongoing Challenges and Prospects
With a 1-year extension planned for this project (and extend through Oct
2002), we expect to develop
a number of additional features not implemented at this time. These will
help to realize a true regional (5-state), dynamic web application server
that brings phenology models and maps to a wide range of users, and allows
for integration with a wide variety of online Extension tools that improve
agricultural and pest management decision making across virtually all commodities
and situations. We have all GIS data and capabilities in place to extend
the daily and online degree-day maps to the 5-state region, and expect a
new system to be developed and deployed by the middle of the 2001 growing
season. Local IPM monitoring networks throughout the region will be increasingly
able to use these general tools to customize products to serve local needs.
Another major effort of this project targets the continued automation of all processes involved in collecting, correcting, and serving of weather data and degree-day products. To serve this need, a new program will be developed to automate the interpolation of missing data using a combination of nearest-neighbor, topographic and geographic adjustment, and historical database adjustment of missing values.
As growers and farm advisors continue to adopt new internet technologies, it is imperative to provide proper training, documentation, integration, and support. All of these needs elicit a multi-faceted, collaborative, and leveraged approach with partners from all aspects of IPM research and implementation. It is a challenge to bring all parties "on-board" in a timely fashion, and to balance the development of technologies that rely on one another. For example, use of email support lists is facilitated by having supportive online content - which is developed in response in part from feedback and needs expressed by end-users. With the web now approximately six years of age, dynamic applications such as phenology models are finally becoming available to a much wider audience. Our approach is to emphasize development of dynamic online tools, and to provide incentives for adoption beyond a static "book" approach to serving of IPM information. This poses new challenges, and with increased opportunity for feedback and information exchange, we hope to help to shorten the gap between IPM research and implementation.
Training Events Resulting From this Project
Training events serve an important role in extension of these new technologies. Given the broad scope and extensive technical challenges in building this program, training and workshop courses have been conducted on a per-request basis. The following workshops have been conducted to date:
Coop, L. B. 2001. Applied Phenology Models: combining weather networks, degree-days, GIS, and the web for IPM decision support. MSU Crop Pest Management School. Bozeman MT. Jan. 2001.
Coop, L. B. 1999. Introduction to online phenology models for IPM decision support, OSU Extension Service IPM computer laboratory workshop with Cherry producers. The Dalles, Oregon. May 1999.
Presentations and Publications Resulting from this
Project
Coop, L. B. 2001. Applied Phenology Models: combining weather networks, degree-days, GIS, and the web for IPM decision support. MSU Entomology Dept. Seminar. Bozeman MT. Jan. 2001.
Coop, L. B. 2000. Online application server for phenology models and maps. XXI International Congress of Entomology. Iguassu Falls, Brazil. Aug. 2000.
Coop, L. B. 2000. Online decision support for IPM. Conf. Proc. Apr. 7, 1999. IPM in Oregon:
Achievements and Future Directions. Oregon State University Integrated Plant Protection
Center Special Report 1020. Corvallis, Oregon. Oct. 2000.
Coop, L. W. Bajwa, and M. Kogan. 1999. On-line phenology modeling and mapping using weather station networks, climate maps and GIS. Entomological Society of America, National Meetings. Atlanta, GA. Dec. 1999.
M. Kogan, L. Coop, and W. Bajwa. 1999. Extending the principles and lessons learned outside the project and to other commodities. In: "Areawide Program for Suppression of Codling Moth: Summary of the Effect of 5 years of Control". Washington Horticultural Association Annual Meeting. Wenatchee, WA. Dec. 1999
Coop, L. B. 1999. Update on Online weather data and phenology models for areawide codling moth management. Areawide Codling Moth Research Reports. Yakima, WA. Nov. 1999.
Coop, L. B. 1999. Phenology models on the world wide web. OSU Entomology Dept. Seminar, Corvallis, OR. Feb. 1999.
References Cited
Bechinski, E. J., D. O. Everson, C. D. McNeal, and J. J. Gallian. 1990. Forecasting peak seasonal capture of sugarbeet root maggot (Diptera: Otitidae) with sticky-stake traps in Idaho. J. Econ. Entomol. 83:2078-85.
CESAES 1985. The Montana Small Grain Guide. Cooperative Extension Service Agricultural Experiment Station, Montana State University, Bozeman Bulletin 364, August 1985.
Kelly, A. M. 1987. Oviposition behavior and thermal constants for egg development of the filbertworm, Cydia latiferreana (Lepidoptera: Tortricidae). OSU Entomology Dept. M. S. Thesis.
Lancashire, P. D., H. Bleiholder, T. van den Boom, P. Langeluddeke, R. Strauss, E. Weber and A. Witzenberger. 1991. A uniform decimal code for growth stages of crops and weeds, Ann. Appl. Biol. 119:561-601.
Omeg, M. 2001. The title of my thesis is: Biology and Management of the Obliquebanded Leafroller, Choristoneura rosaceana (Harris) (Lepidoptera: Tortricidae), in Sweet Cherry. OSU Entomology Dept. M. S. Thesis.
Schneitzer, A. A., Miller J. F. 1981. Description of Sunflower Growth Stages. North Dakota State Univ., Fargo, ND and the USDA-SEA-AR.
SPGB. 2000. Pulse Production Manual. Saskatchewan Pulse Growers Board, 218 - 111 Research Drive, Saskatoon Canada S7N3DR. April 2000.
Spotts, R. A., L. A. Cervantes. 1991. Effect of temperature and wetness on infection of pear by Venturia pirina and the relationship between preharvest inoculation and storage scab. Plant Dis. 75:1204-1207.
Tanaka, D. L., N. R. Riveland, J. W. Bergman, and A. A. Schneiter. 2000, A Description of Safflower Plant Development Stages. Joint contribution from USDA-ARS, Northern Plains Area and Agricultural Experiment Station, North Dakota University, Fargo, ND. (in press)