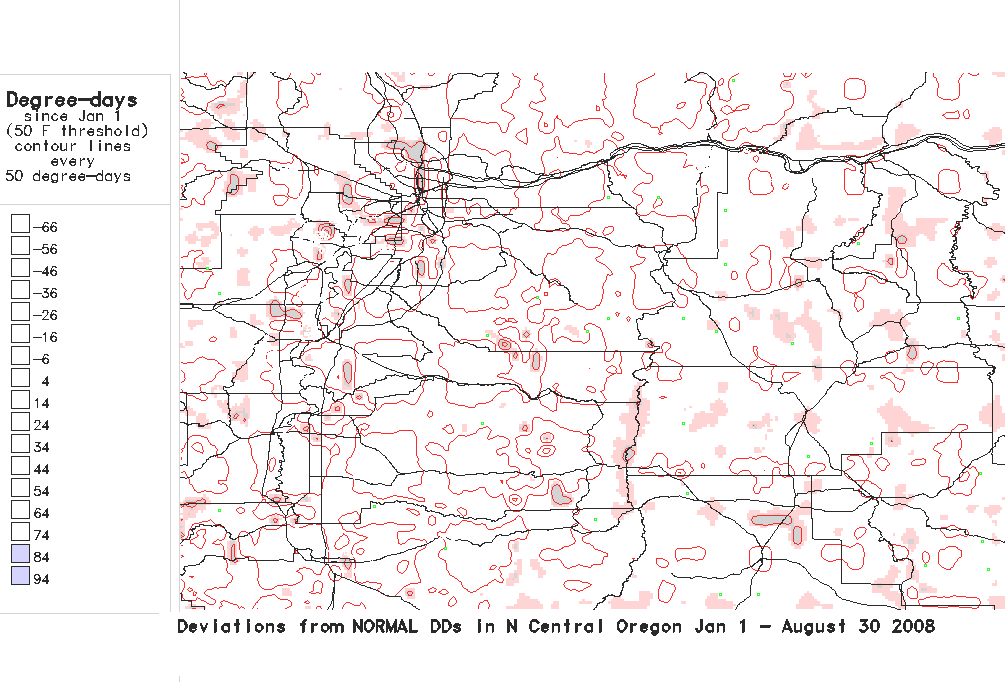
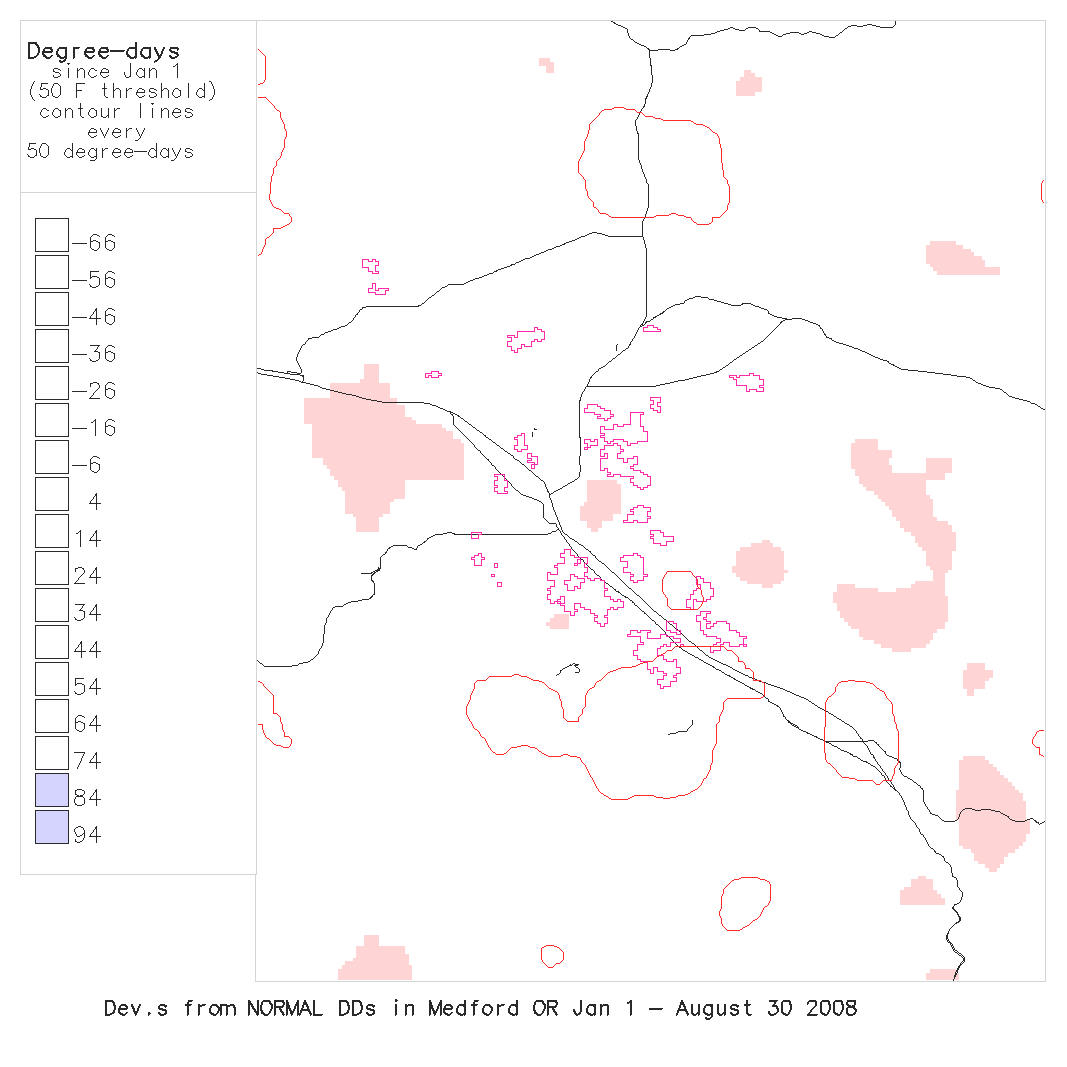
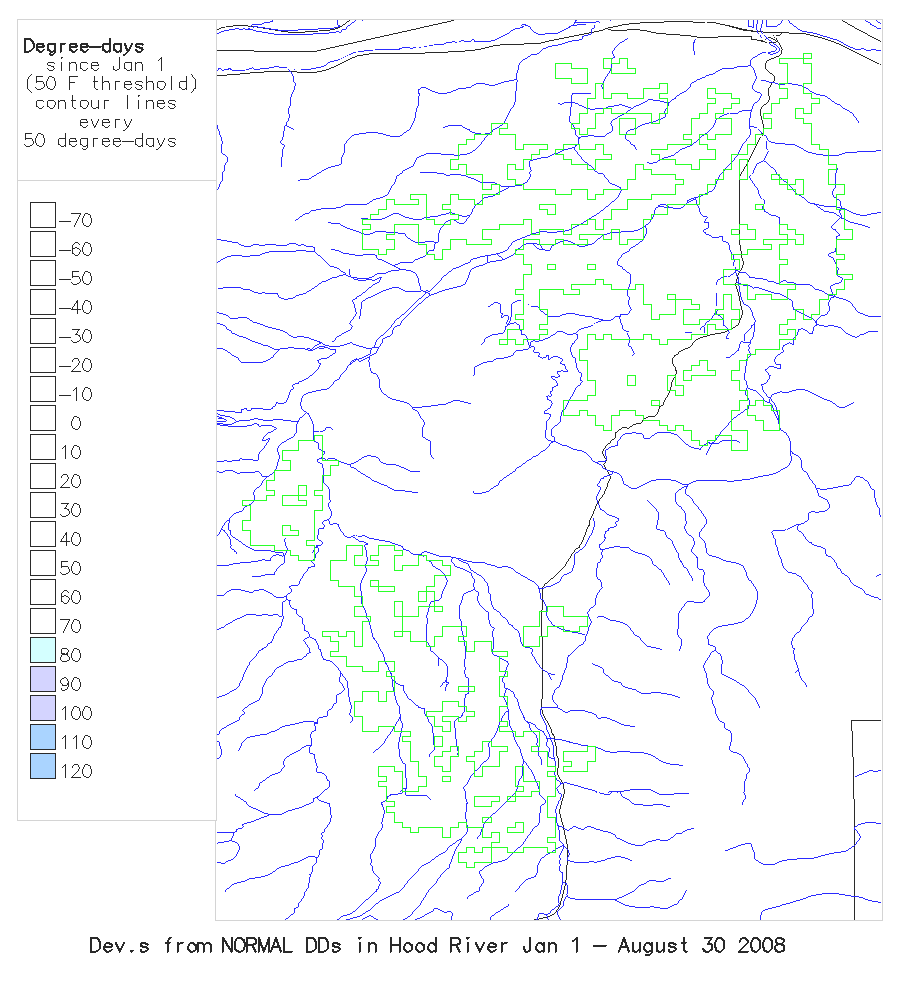
Daily Degree-Day Maps of Oregon
See also the new page for Hermiston - Downy Brome and Ontario - Lygus Bug
and the new page for Oregon with interactive features
Updated daily
These maps are calculated using the GIS GRASS 4.2.1, and are based on 1) near-real time temperature data from up to 25 AgriMet , 18 HydroMet, 38 National Weather Service , and ca. 80 RAWS weather stations, 2) historical average temperature data from over 200 stations, 3) PRISM monthly max and min temperature maps, and 4) inverse-distance squared interpolations of differences between PRISM map-based and real-time degree-day calculations. See More info. on methodology for creating DD maps. Also try out our new Degree-day Mapping Calculator for more control over calculation and mapping options.
(NOTE: you may need to use your browser's RELOAD or REFRESH button for latest images)
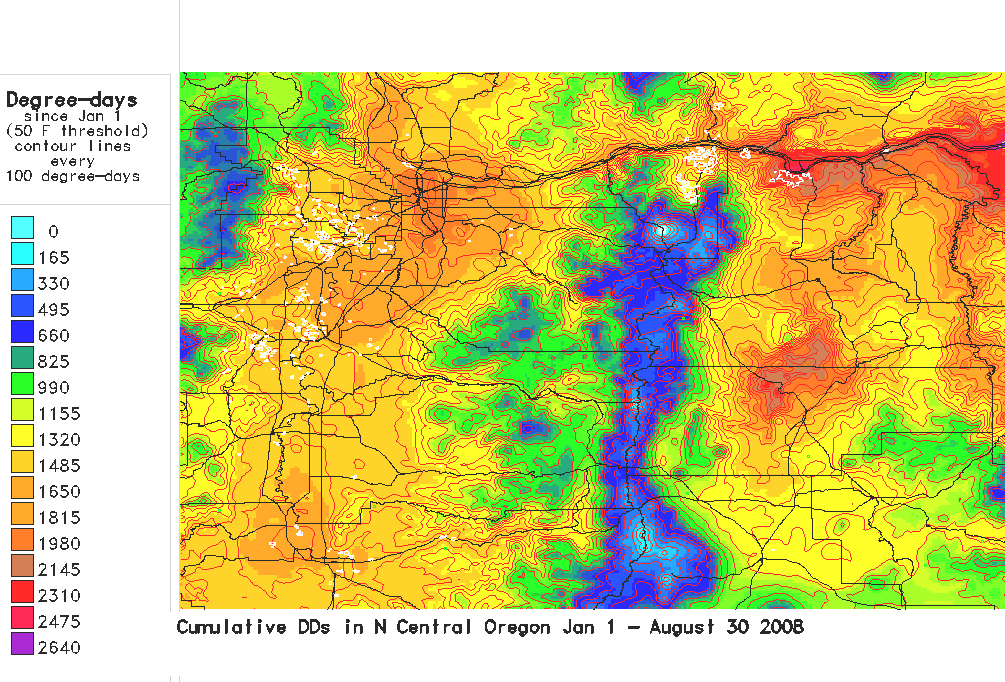
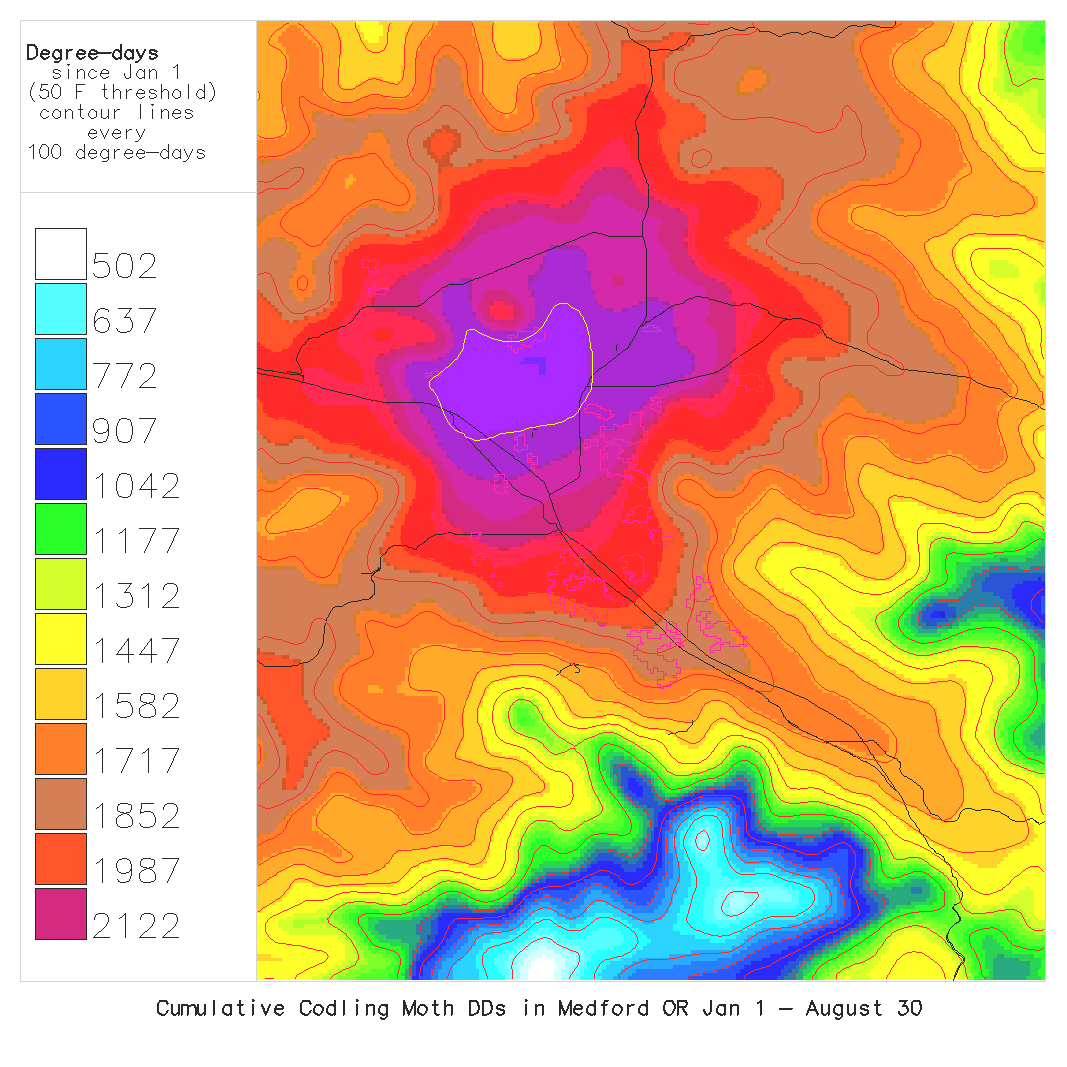
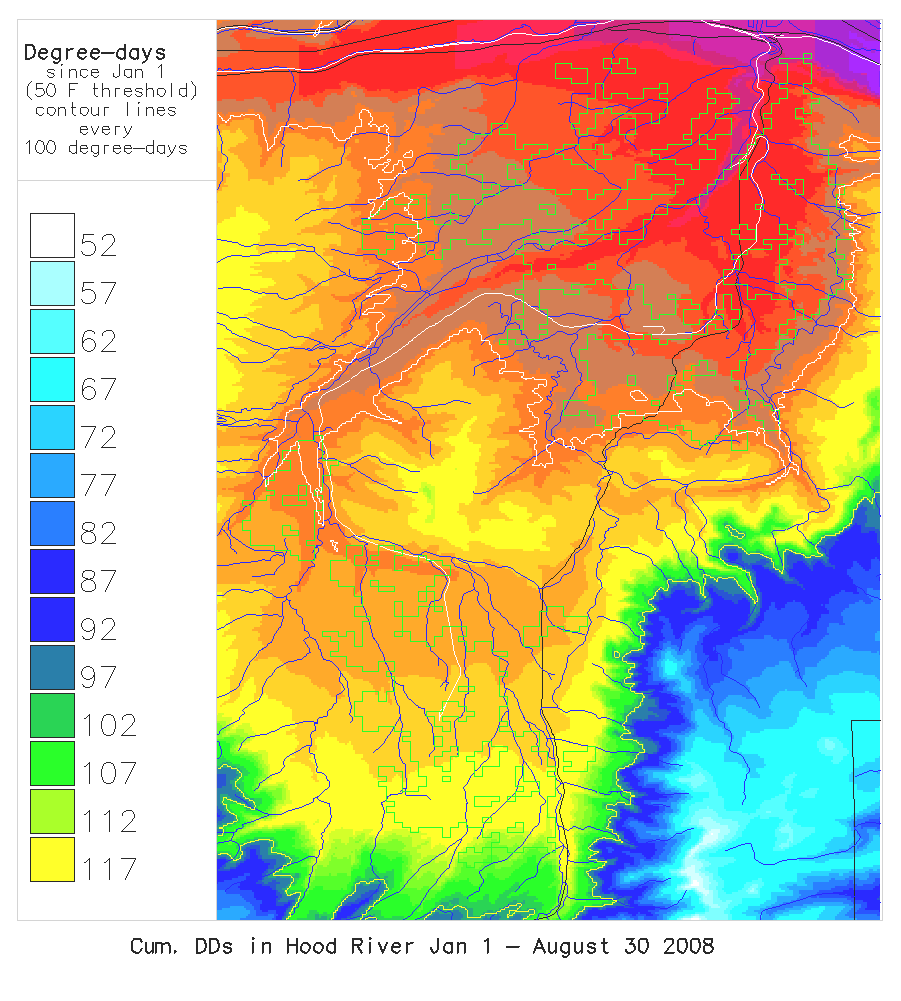
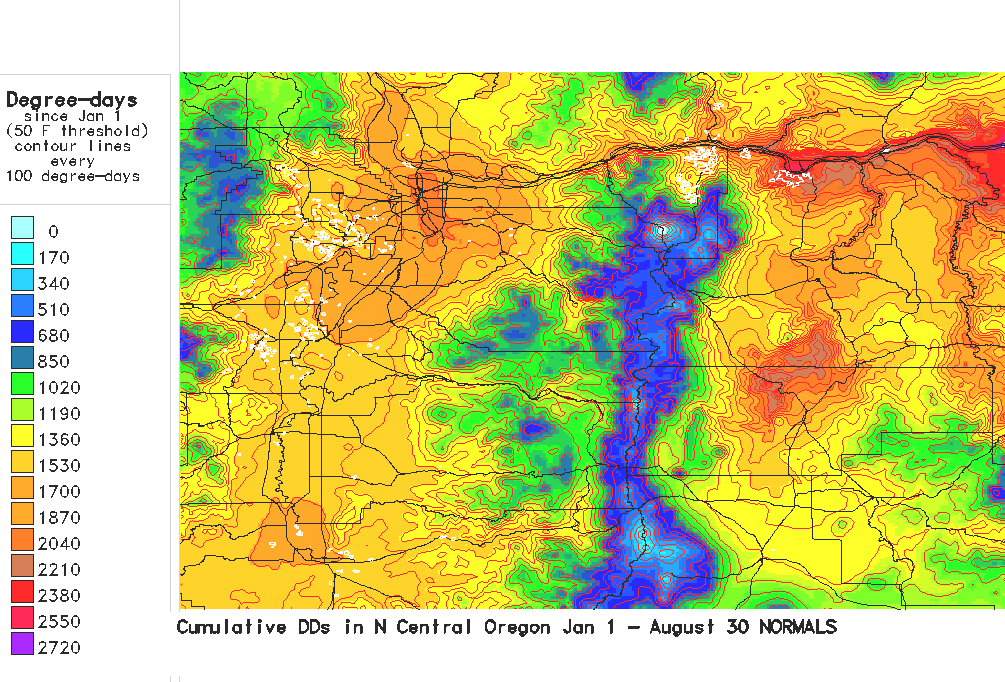
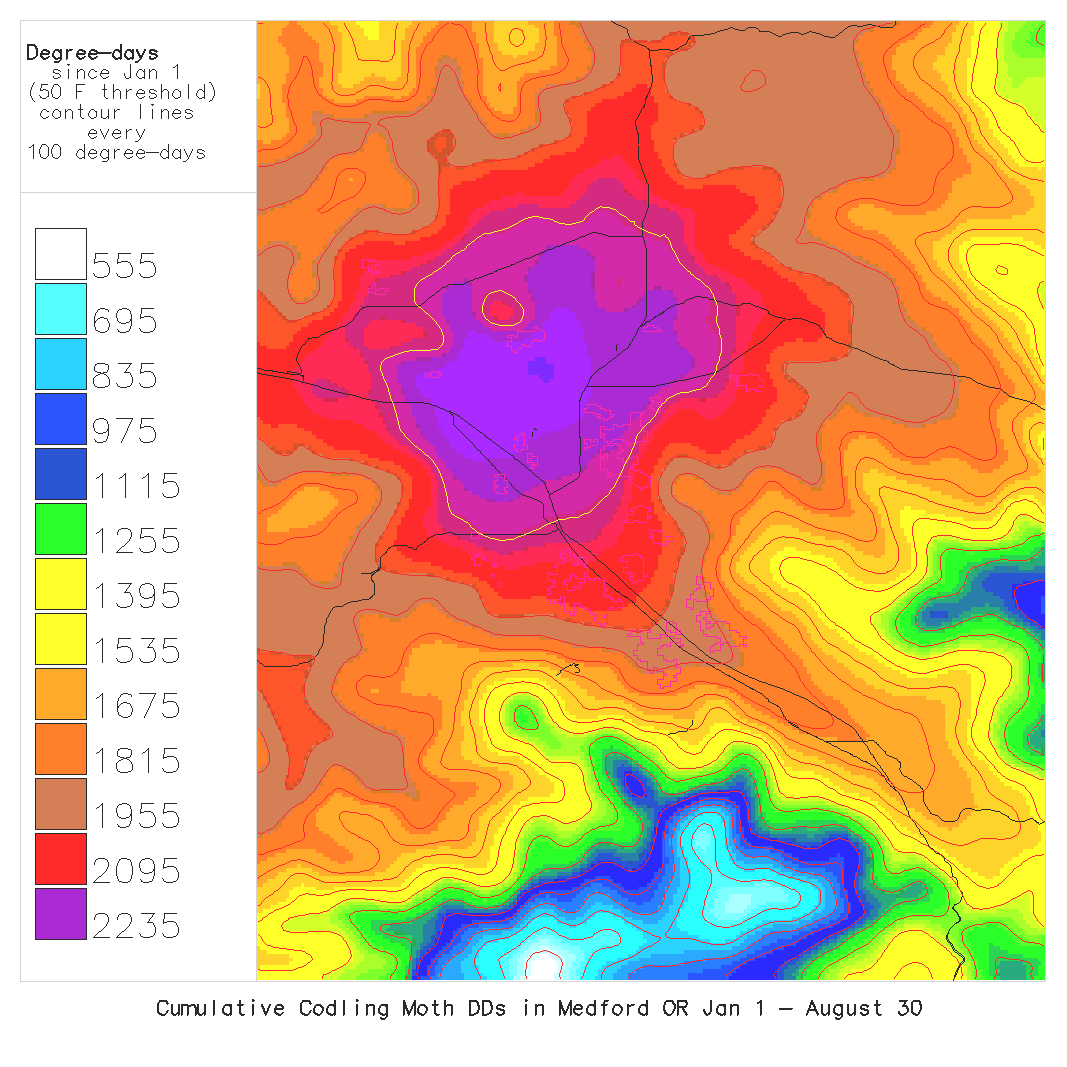
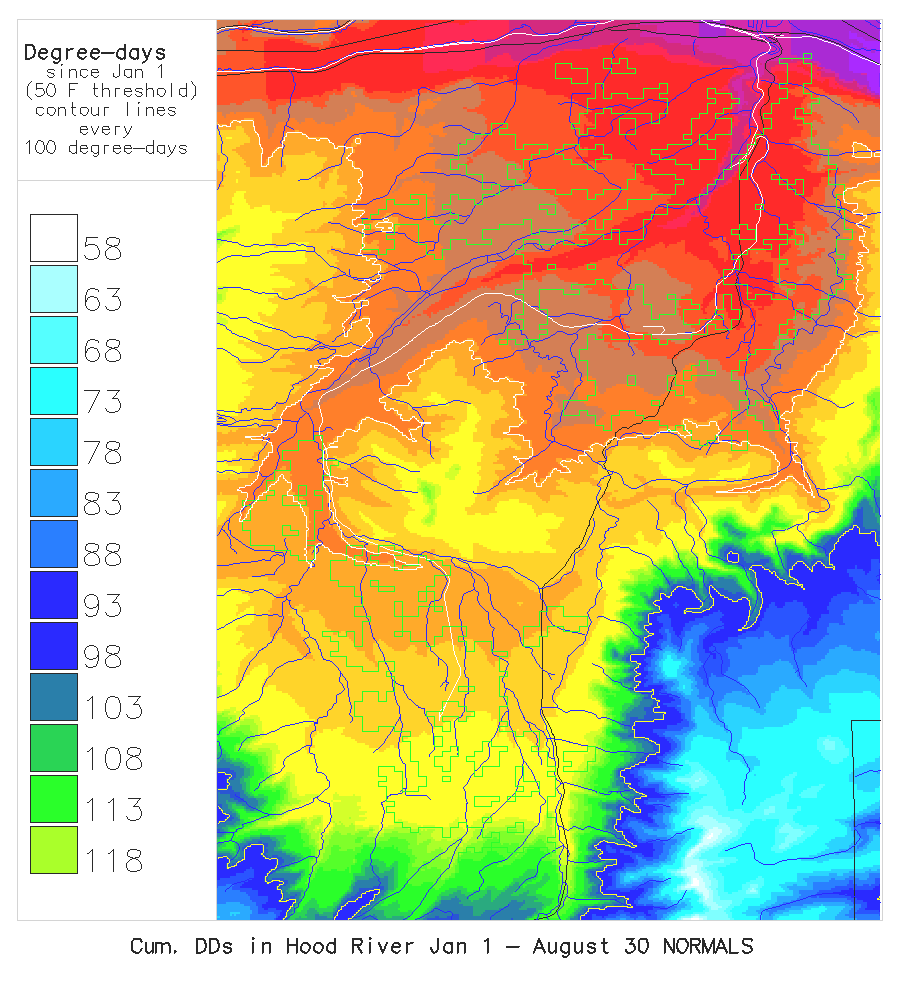
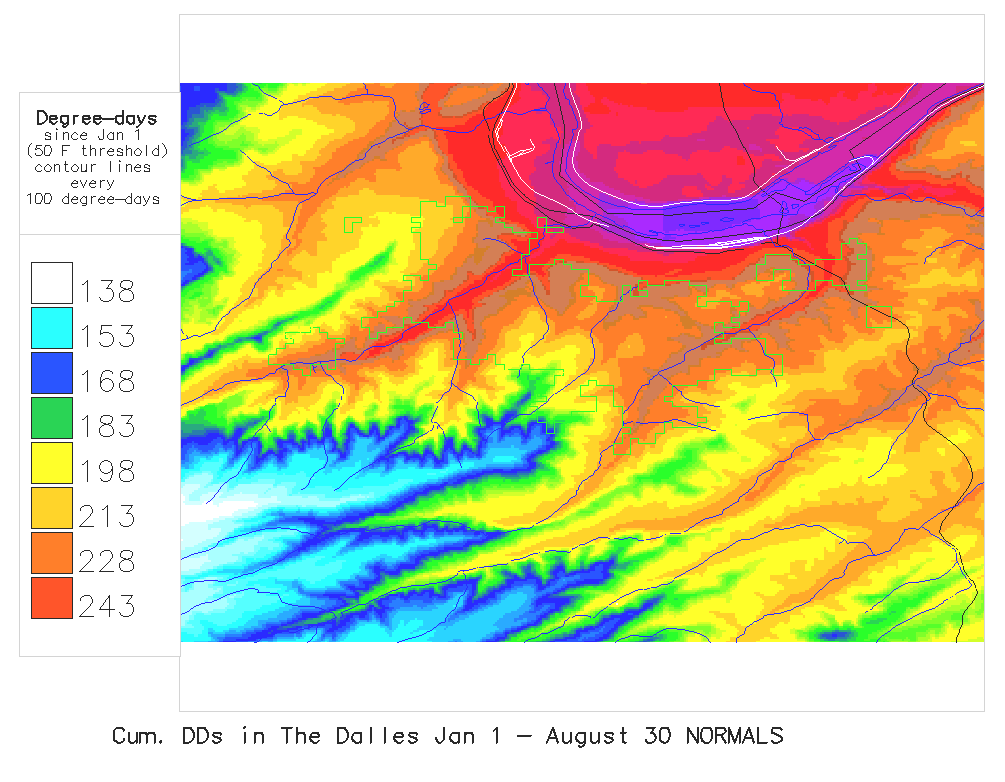
| Series created daily using a 50 degrees F. lower threshold: | |||||
|---|---|---|---|---|---|
| Jan 1 - yesterday | Oregon | N. Central Oregon | Medford Region | Hood River | The Dalles |
| Current year | 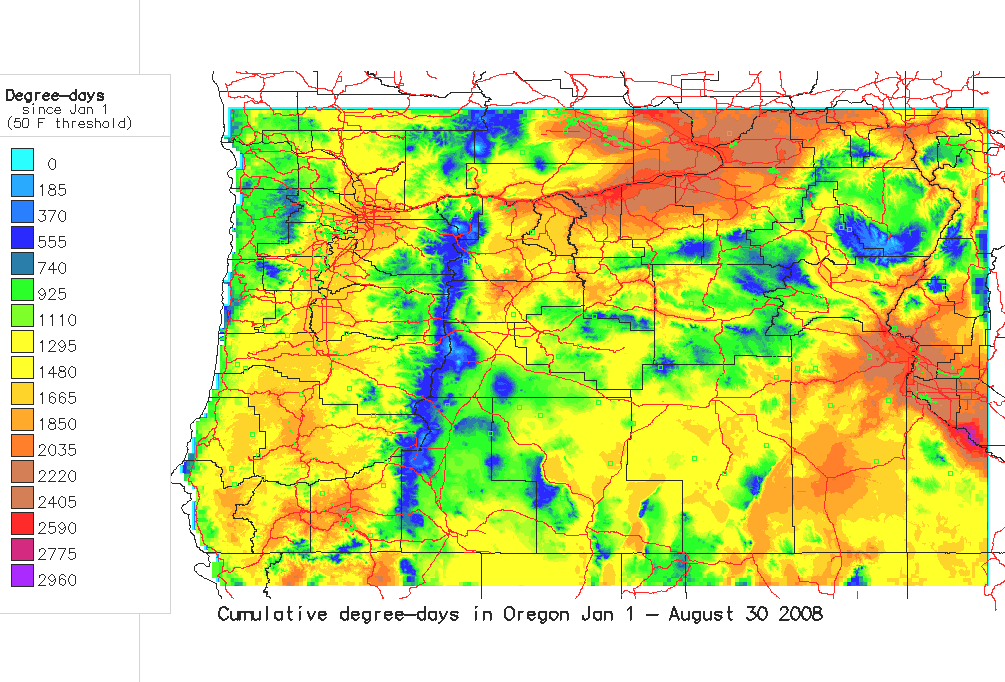
|
 |
 |
 |
 |
| Normals (Historical avgs) |  |
|
|
|
|
| Deviations from Normals | 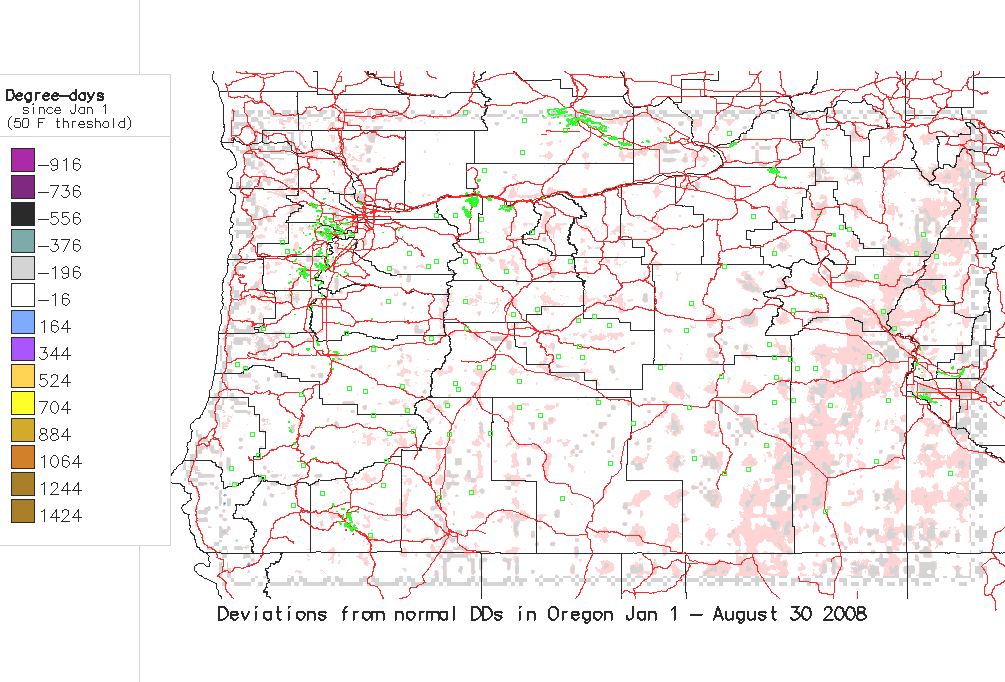
|
|
|
|

|
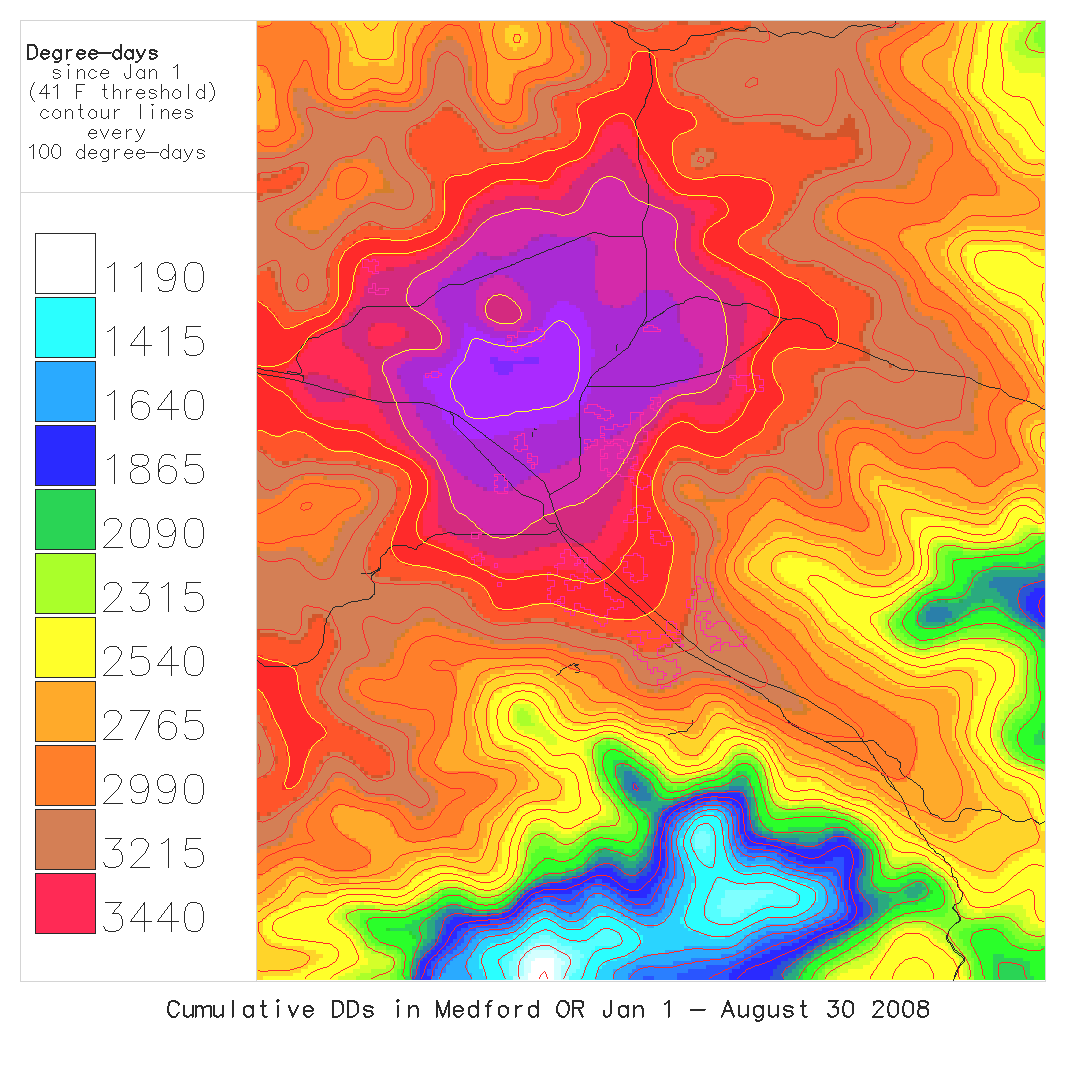
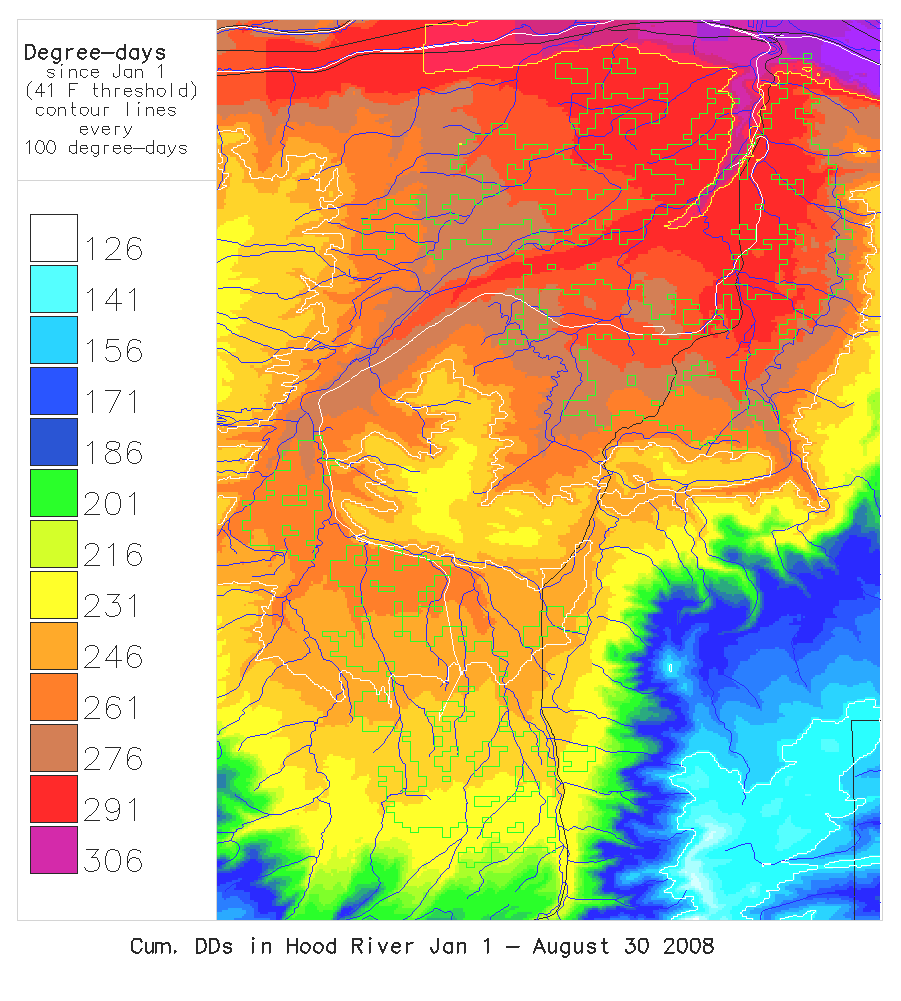
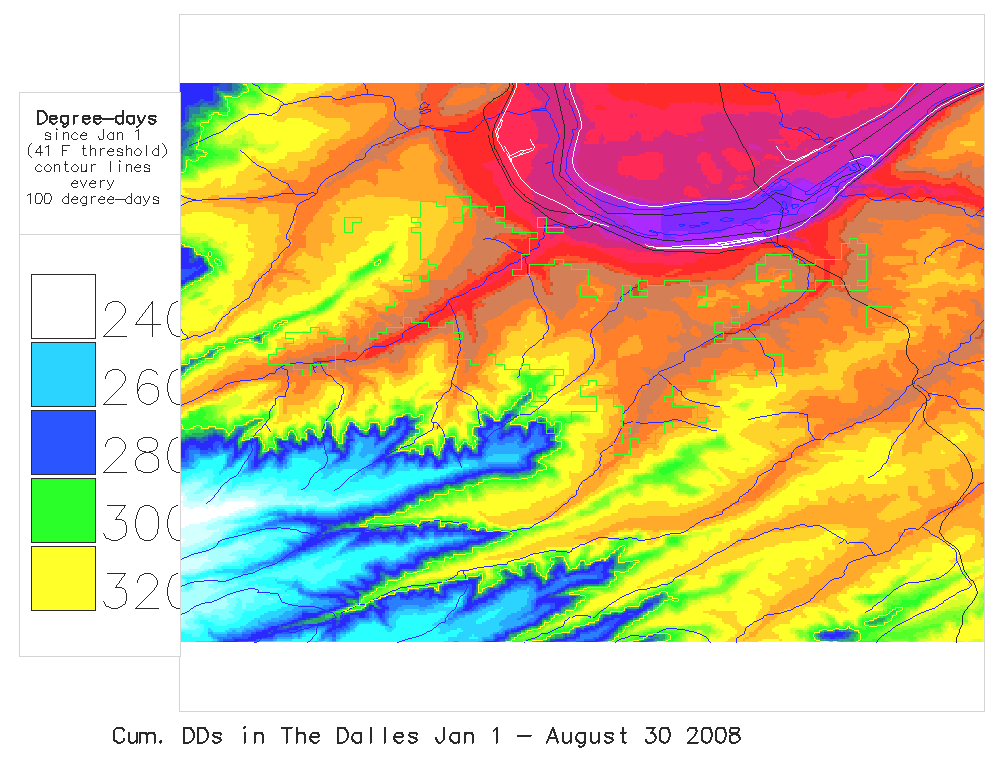
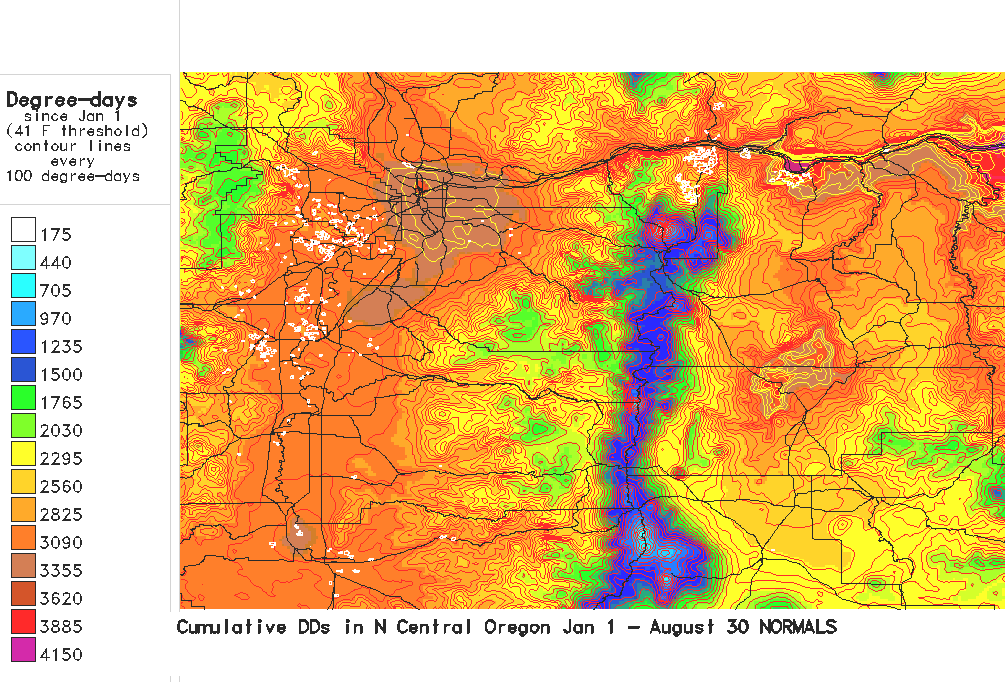
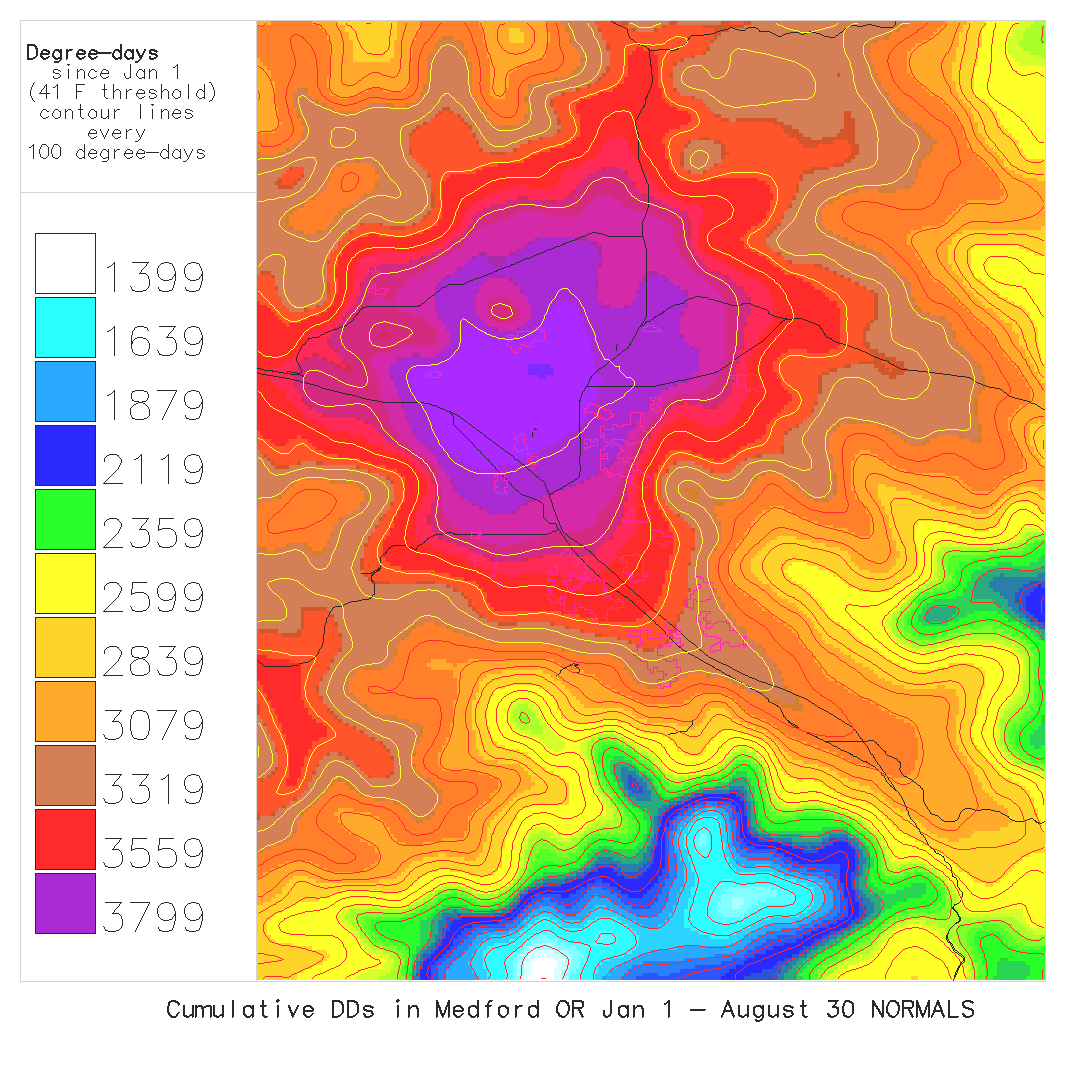
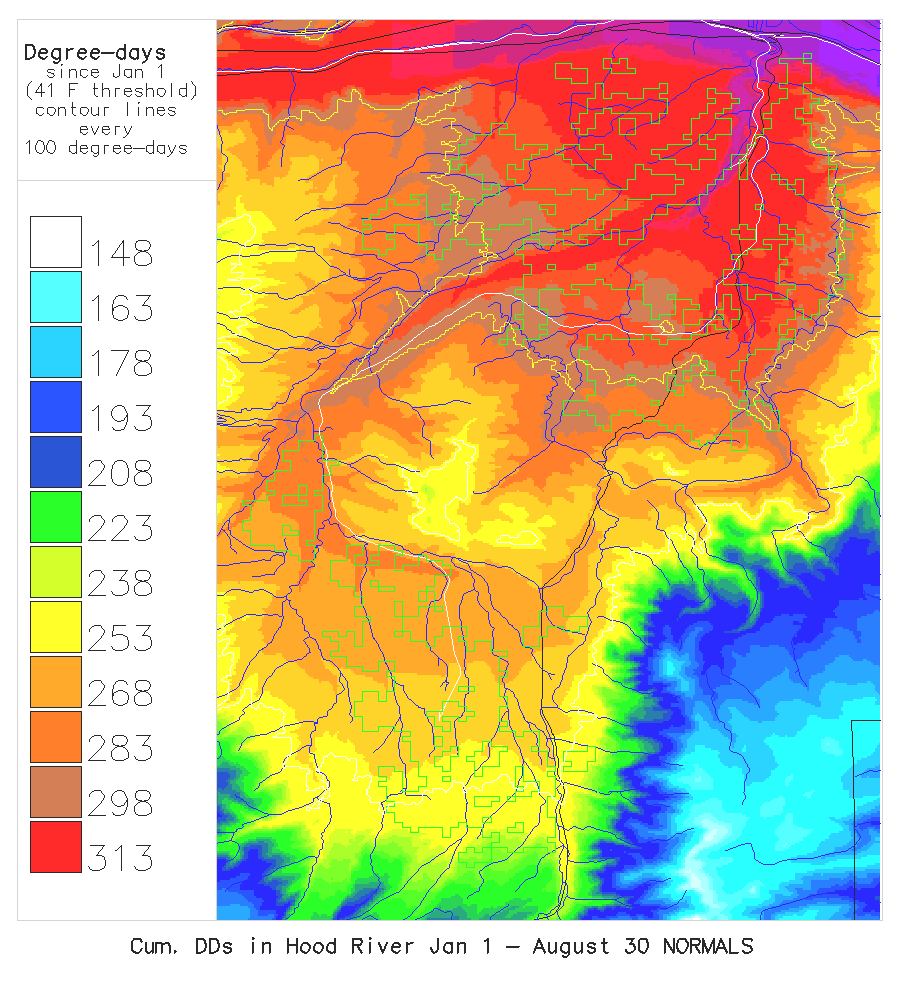
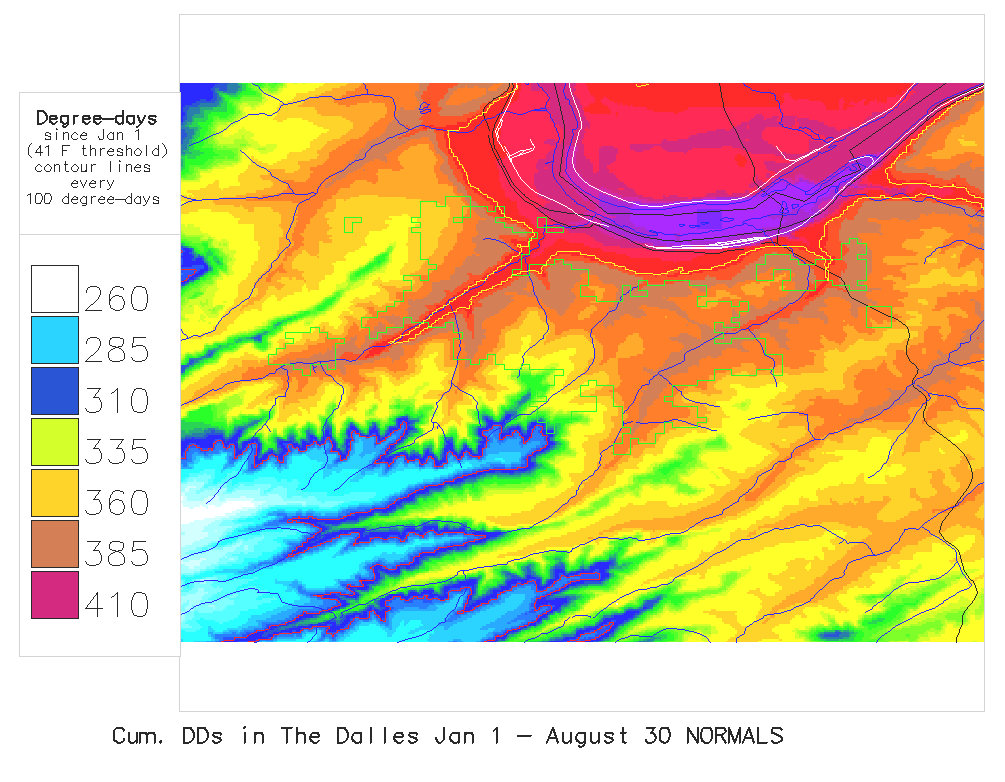
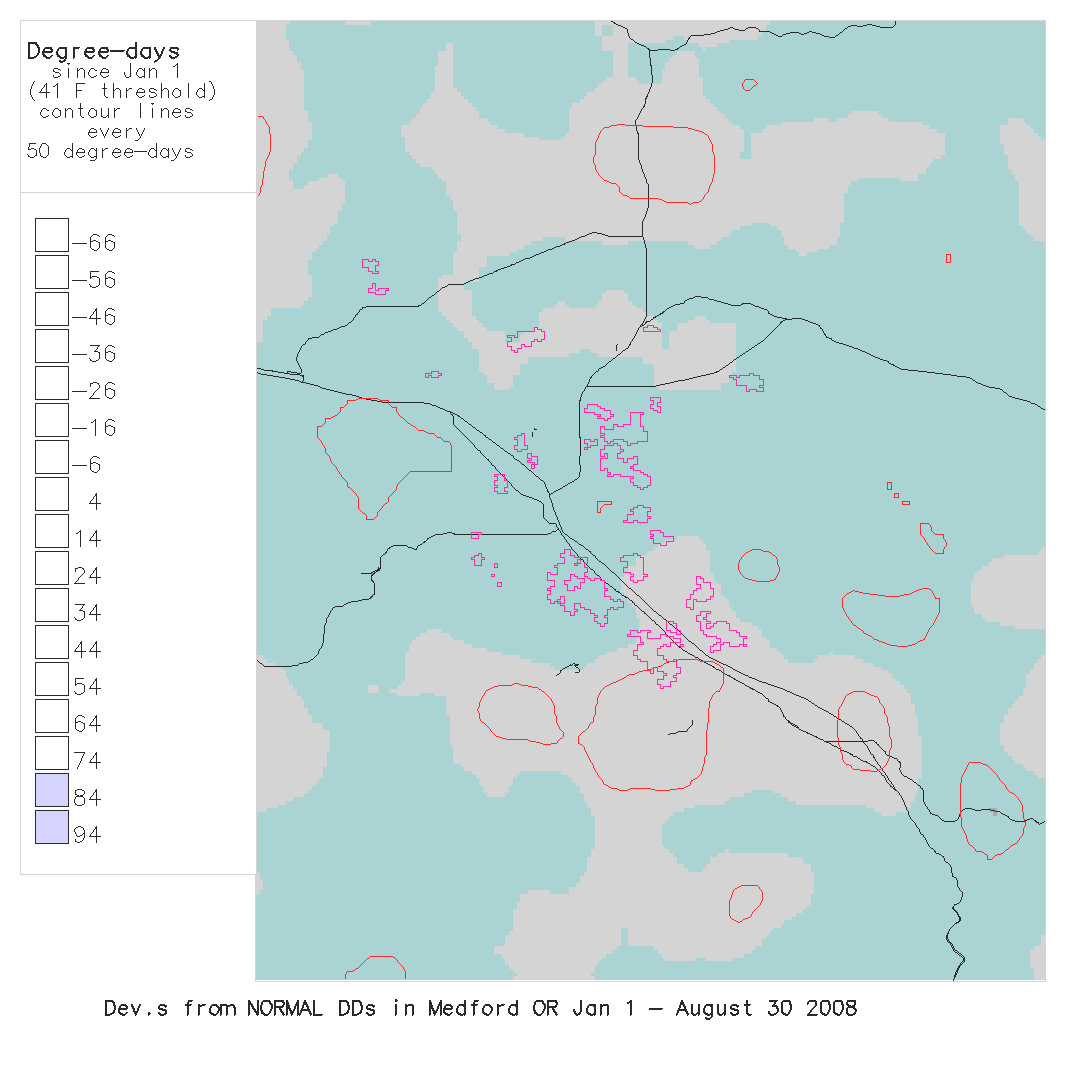
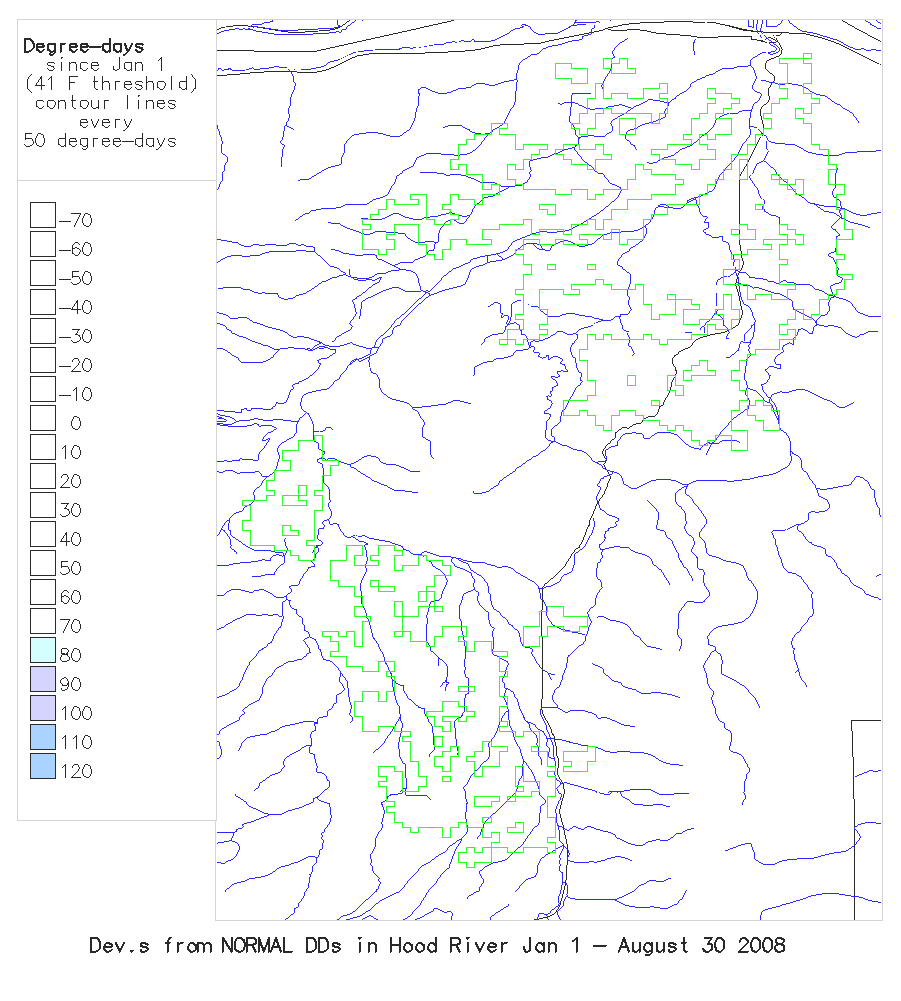
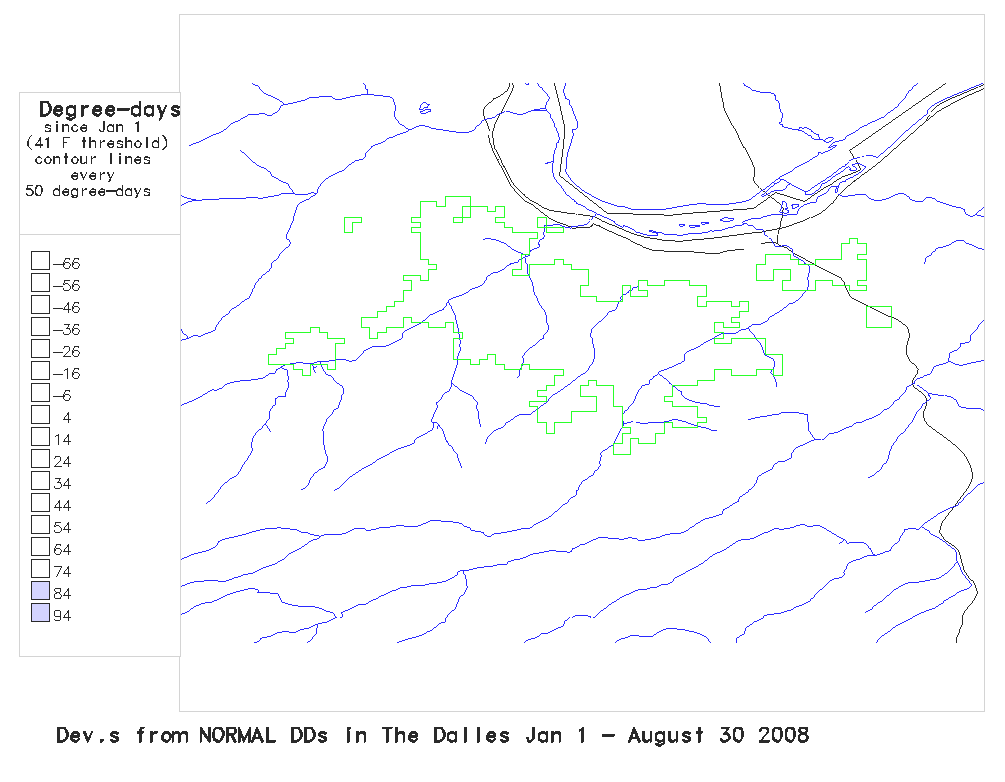
| Series created daily using a 41 degrees F. lower threshold: | |||||
|---|---|---|---|---|---|
| Jan 1 - yesterday | Oregon | N. Central Oregon | Medford Region | Hood River | The Dalles |
| Current year | 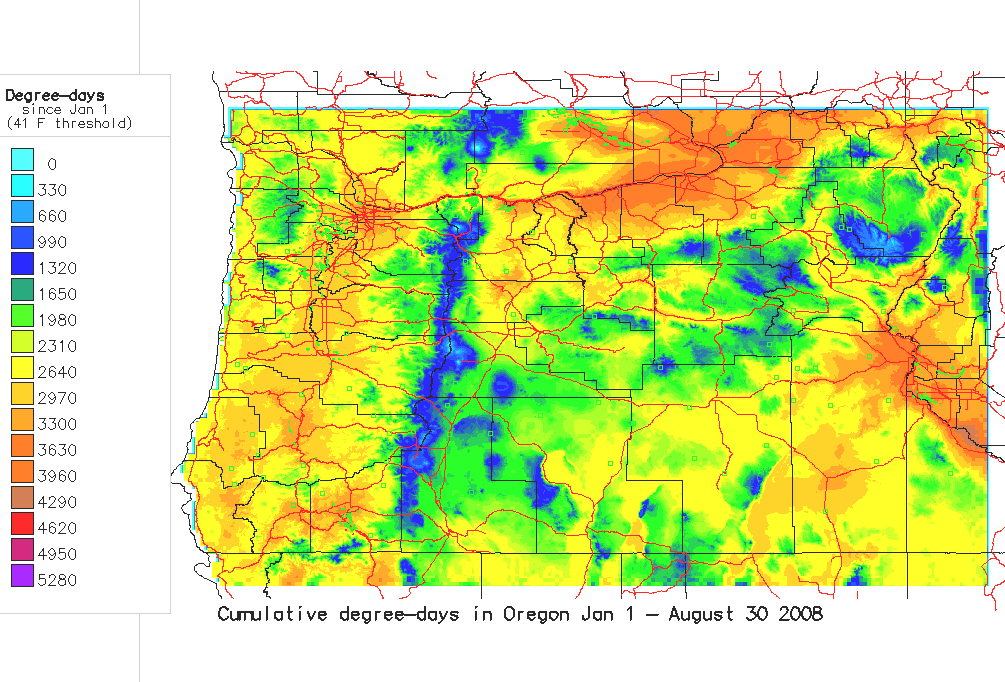
|
 |
 |
 |
 |
| Normals (Historical avgs) | 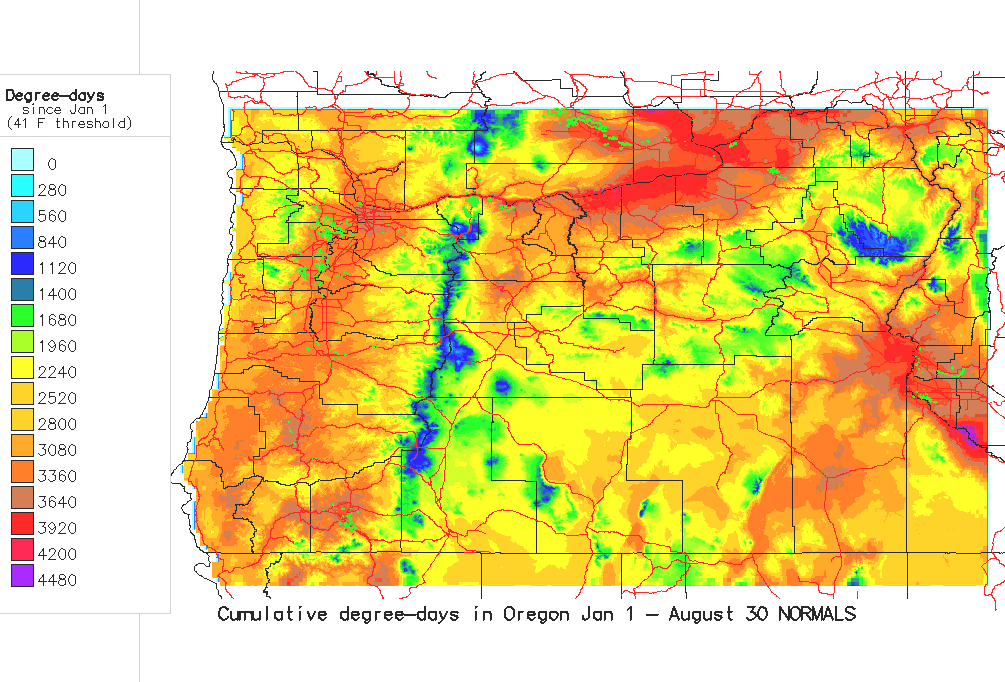 |
|
|
|
|
| Deviations from Normals | 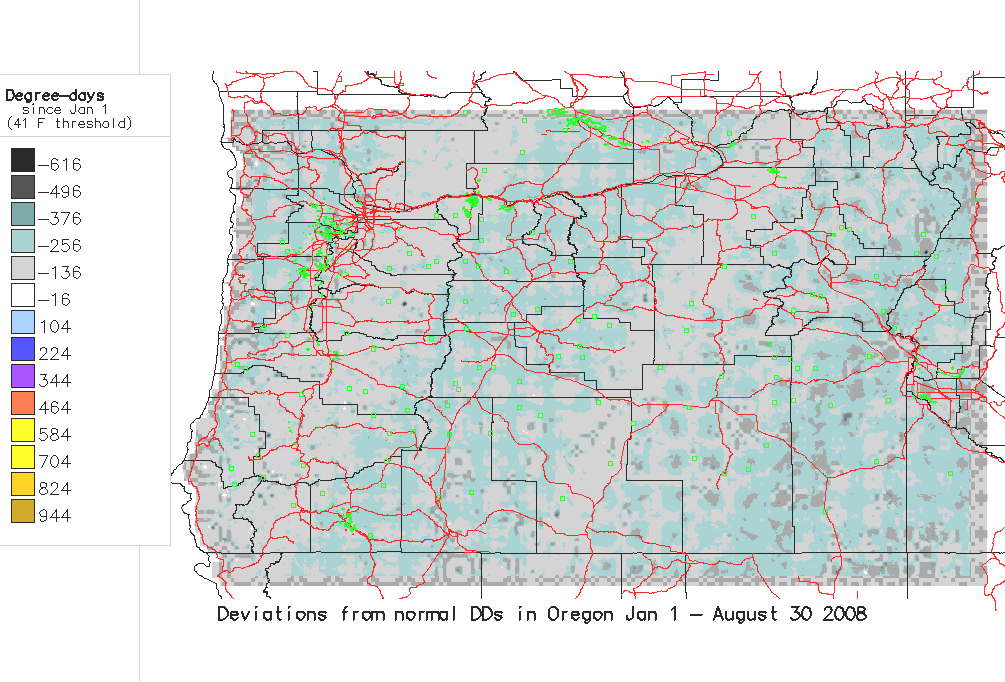
|

|
|
|
|
Other information:
Brief summary of methods used to create
degree-day maps
Backup of all previously
created maps
[Home] [Intro] [Data Table] [Data Map] [DD Mapmaker] [DD Calc] [DD Models] [Links]
This project funded in part by grants from the USDA-Western Regional IPM program and the USDA areawide codling moth program.
 |
This page on-line since May 4, 1998
This page updated Apr 14, 2005
Contact Len Coop at coopl@bcc.orst.edu
if you have any questions about this information.