RAWS Network - other tables for OK include: All Networks, CWOP/APRS, GPSMET, HADS, METAR, see our homepage.
|
Also try the full-featured calculator/DD model | |
|
| |||||||||||||||||||||||||
|
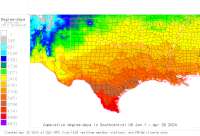
Oklahoma USA Weather Data, Plant Disease Risk and Degree-Day Models RAWS Network - other tables for OK include: All Networks, CWOP/APRS, GPSMET, HADS, METAR, see our homepage. | |||||||||||||||||||||||||
| |||||||||||||||||||||||||
| # | Location linked to hourly weather, plant disease models and forecasts using "Mypest Page" removed due to excessive bot activity |
County |
Re- cent data QA |
Fore- cast based virt data |
Nearby station based virt data |
Station code, links to NWS recent weather |
Links to NWS fore- casts |
Net- work Elev. (ft) |
Lat./ Long. (Dec. Deg.) |
Max-min temperature data and degree-days (click radio button to calc.) |
10 yr avgs |
30 yr avgs |
nmme fcast |
cfs fcast |
||||||||||
|---|---|---|---|---|---|---|---|---|---|---|---|---|---|---|---|---|---|---|---|---|---|---|---|---|
| 1 | BROKEN BOW | McCurtain |
|
na na |
na na |
|
|
500 | 34.05000 -94.73694 |
2021
|
2020
|
2019
|
2018
|
2017
|
2016
|
AVG | AVG | nmme | cfs | |||||
| 2 | CHEYENNE | Roger Mills |
|
na na |
na na |
|
|
2352 | 35.70806 -99.90444 |
2021
|
2020
|
2019
|
2018
|
2017
|
2016
|
AVG | AVG | nmme | cfs | |||||
| 3 | CLEARVIEW | Okfuskee Cou |
|
na na |
na na |
|
|
980 | 35.42528 -96.19611 |
2021
|
2020
|
2019
|
2018
|
2017
|
2016
|
AVG | AVG | nmme | cfs | |||||
| 4 | INDIAN CITY | Caddo County |
|
na na |
na na |
|
|
1330 | 35.03639 -98.23222 | nmme | cfs | |||||||||||||
| 5 | KIAMICHI | Le Flore |
|
na na |
na na |
|
|
680 | 34.75556 -94.98306 |
2021
|
2020
|
2019
|
2018
|
2017
|
2016
|
AVG | AVG | nmme | cfs | |||||
| 6 | OKEOA PORT1 | Coal County |
|
na na |
na na |
|
|
600 | 34.47778 -96.21833 |
2021
|
nmme | cfs | ||||||||||||
| 7 | OSAGE | Osage County |
|
na na |
na na |
|
|
865 | 36.67028 -96.34028 |
2021
|
2020
|
2019
|
2018
|
2017
|
2016
|
AVG | AVG | nmme | cfs | |||||
| 8 | SEILING | Dewey County |
|
na na |
na na |
|
|
1657 | 36.13750 -98.74167 | nmme | cfs | |||||||||||||
| 9 | WICHITA | Kiowa |
|
na na |
na na |
|
|
1800 | 34.76056 -98.74167 |
2021
|
2020
|
2019
|
2018
|
2017
|
2016
|
AVG | AVG | nmme | cfs | |||||
[USPEST.ORG/WEA Home]
[Intro]
[US DD Mapmaker]
[Main Table Index]
[Links]


|